 Jacob Wale Mobolaji
- Department of Demography and Social Statistics, Obafemi Awolowo University, Ile-Ife, Nigeria
Objectives: Many urban-dwelling older Nigerians are multidimensionally deprived and are unable to meet their daily financial, nutritional, and healthcare needs. This has implications for their health outcomes, yet it has been under-researched. This study assessed the multidimensional deprivation index (MDI) of urban-dwelling older Nigerians and the associated factors.
Methods: The study analysed a weighted sample of 5,225 older persons aged ≥60 years from Nigeria’s Demographic and Health Survey, 2018. MDI was estimated, and associations were examined using a multilevel multinomial logistic regression model.
Results: Nationally, 75% of the older persons were multidimensionally deprived, with 27% severely deprived. Women (36%) were more severely deprived than men (20%). Those in the Northern regions (38%–40%) were the most deprived. Higher MD risk was associated with female gender and older ages ≥70–79 years. Conversely, lower risk was associated with households headed by family and residence in educated communities. Community variation accounts for 10.4% and 35.9% of the MD and severe MD risks, respectively.
Conclusion: This study suggests socioeconomic interventions that address gender disparities and target highly deprived regions, with consideration for individual and community characteristics.
Introduction
Old age is characterized by emerging needs and difficulties due to decreasing physical functioning and health deterioration. In Nigeria, the population of older adults is rapidly rising with the associated health challenges [1, 2]. In the next 10 years, the proportion of the population moving into the older age group will be very alarming. The Nigerian government recently approved the first national policy on older people [3], however, the evidence and content provided left more to be desired. Evidence suggests that about 70% of the older Nigerians are vulnerable and poor [4], with the inability to meet their daily financial, nutritional, and healthcare needs; yet little is known about the complexities and dimensions of their poverty and vulnerability. Multiple and co-existing deprivations in the socioeconomic and healthcare resources accentuate the risk of poor health outcomes and lower life expectancy in later life.
The concept of multidimensional deprivation aims at capturing poverty, otherwise referred to as deprivation, in all its forms as conceived in the sustainable development goal (SDG) 1 [5]. The concept relates to the measures of household deprivations in multiple dimensions and their corresponding indicators which include health (measured by child death and nutritional status), education (years of formal education, and child’s school enrolments) and standard of living (sanitation, water, floor, household assets, cooking fuel, electricity) [6–8]. While the multidimensional approach has been adapted to different population sub-groups across the world, especially children and older people [9–12], little has been done in Nigeria. The few multidimensional poverty studies in Nigeria have either focused on the general household or children, with little/no research attention to older adults.
Existing evidence shows that residents of urban settings are socioeconomically better than those in rural geographies [13, 14]. However, there are unassessed disparities and nuances in urban settings. Urban geographies in many developing countries, especially in Nigeria, are susceptible to alarming crime rates, poverty, high cost of living, environmental hazards and socioeconomic inequalities [15–17]. Poverty in the urban setting is linked to the worsening environmental degradation and poor socioeconomic infrastructure coupled with poor governance and institutional deficiencies [18–21]. This study argues that the socioeconomic condition of older urban residents, especially vulnerable older adults residing in slums, is worse than rural dwellers. Although growing old and maintaining wellbeing and resilience in such settings could be challenging, research evidence teasing out the dimensions and intensity of poverty realities of the older residents is lacking in Nigeria. This study examines the extent of multidimensional deprivations and associated factors among older people in Nigeria. The findings from this study will serve as a policy guide for improving the welfare and wellbeing of older people in the country.
Methods
Data Sources and Sample Design
The study employed secondary analysis of household members’ data from Nigerian Demographic and Health Surveys (DHS), 2018. The household version of NDHS is nationally representative and contains demographic, socioeconomic and health information about individuals in the selected households. A stratified two-stage cluster design was used to select households from 904 clusters. A detailed description of the sample design of the survey was already published elsewhere [22]. Information on individual socio-demographic characteristics and household living conditions of a weighted sample of 5,225 older members of the household aged 60 years and above were extracted and used for this study. The sample was weighted to correct the possible sampling errors during the data collection.
Variables and Measures
The multidimensional deprivation index (MDI), the outcome variable for this study, was measured using five dimensions: health, education, standard of living, information and communication, and empowerment. The five dimensions were computed from 15 indicators including the experience of functional limitations; level of education; official language literacy; sources of drinking water; type of toilet facilities regarded as sanitation; type of cooking fuel; access to electricity; type of housing materials; access to sources of information such as television and radio sets; access to means of communication such as mobile phone or landlines; ownership of agricultural land, livestock or farm animals; access to means of mobility; and access to a bank account. Existing studies have used different dimensions and indicators for different population sub-groups. For instance, most authors have used dimensions like disability, standard of living, education and housing burden [9–12]. The Nigerian National Multidimensional Poverty Index 2021 used education, unemployment, health in terms of nutrition food security and time to healthcare, and living standard and poverty. However, the data is not publicly available at the time of this study. The dimensions and indicators used in this study were adapted from the existing studies identified above and based on data availability.
Each of the indicators was assigned a weight within its corresponding dimension, while all dimensions d were given equal relative weight w. The multidimensional deprivation (MD) score m for ith respondent is the weighted sum of all deprivations such that
Deprivation score which lies between zero and one (0–1) was assigned to each respondent. As the number of deprivations increases, the score of the respondent increases to a maximum of 1 which indicates extreme deprivation, while zero represents no deprivation. Please see the details of the variables, measures and corresponding weights in Table 1. Although scholars have used different weighting strategies including multiple cluster analysis [23] and composite scoring of 1 for the deprived and 0 for non-deprived persons in each indicator [12], this study used the latter approach which is the most popularly used weighting method in measuring multidimensional deprivations.
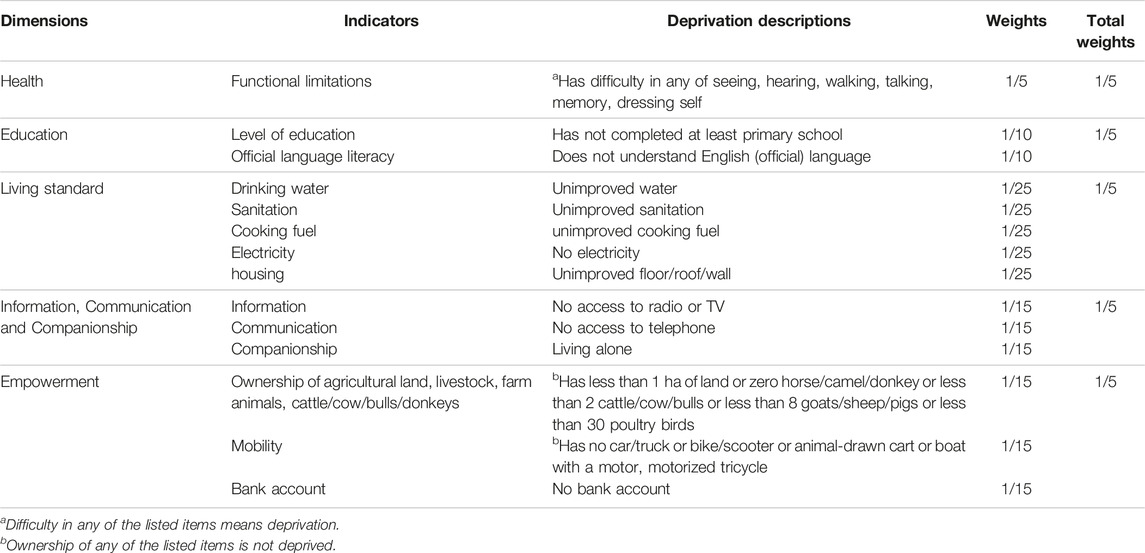
TABLE 1. Dimensions, indicators and measurements of multidimensional deprivation index (Nigeria, 2023).
A deprivation threshold (t) also referred to as the cut-off value which is the percentage of the indicators in which a respondent is deprived was set, such that persons below the t are considered not deprived at the t dimension. Persons who are deprived in 20% of the 15 indicators are deprived at t = 1; those that were deprived in 40% of the indicators are deprived at t = 2; and deprivations in 60%, 80% and 100% of the indicators are deprived at t = 3, t = 4 and t = 5, respectively. A cut-off value of 40% (t = 2) was regarded as MD in this study. Though some studies have used a cut-off point of t = 1 for MD, the choice of cut-off t = 2 was based on the high poverty level in the country. Available evidence suggests that raising the cut-off point helps to adjust for the poverty level in poverty-tolerant contexts of low- and middle-income countries (LMIC) [11].
Overall, multidimensionally deprived persons were identified from the MDI. Persons who were deprived in less than 20% of the indicators were categorised as not deprived; individuals who were deprived in 20%–39.9% of the indicators were categorised as being vulnerable to MD; while persons deprived in 40%–59.9% of the indicators were referred to as being multidimensionally deprived; and those that were deprived in ≥60% of the indicators were categorised as having severe MD. For inferential statistical tests and multivariable analysis, the MD levels were recoded into three: no MD (merging not deprived with vulnerable to MD) with code = 0, multidimensionally deprived (code = 1) and severe MD (code = 2).
The independent variables are the individual socio-demographic, household and community characteristics of the respondents. The sociodemographic characteristics include age, sex, marital status, sex and age of their household head. The community variables include community level of education and poverty level (each categorised as low, medium and high), and region of residence. The community variables were generated from the existing variables, except the region of residence.
Data Analysis
The data for this study was analysed in two sections using Stata version 15.1 software. The first section addressed the estimates of the multidimensional deprivation index while the second section focused on the predictors of multidimensional deprivation among older adults in Nigeria using the multilevel multinomial logistic regression model.
Multidimensional Deprivation Estimates
The multidimensional deprivation measures including the headcount ratio (H), intensity (I), relative shares of MD, and the adjusted headcount ratio (R0) as well as their gender and regional disparities were estimated and presented in Tables 2–4. According to Alkire and Foster [8], the headcount ratio H indicating the proportion of respondents with multiple deprivations is given by
Where p is the number of respondents who are multidimensionally deprived. This is the incidence of MD in the population while n is the total population. In this study, the headcount ratio of multidimensionally deprived older persons was estimated using the above formula, expressed in percentages and presented at various cut-off values. The H of older Nigerians were estimated for those who were vulnerable to multidimensional deprivation (t = 1); multidimensionally deprived (t = 2); and those with severe multidimensional deprivation (t ≥ 3). The estimates were also obtained by gender and region of residence.
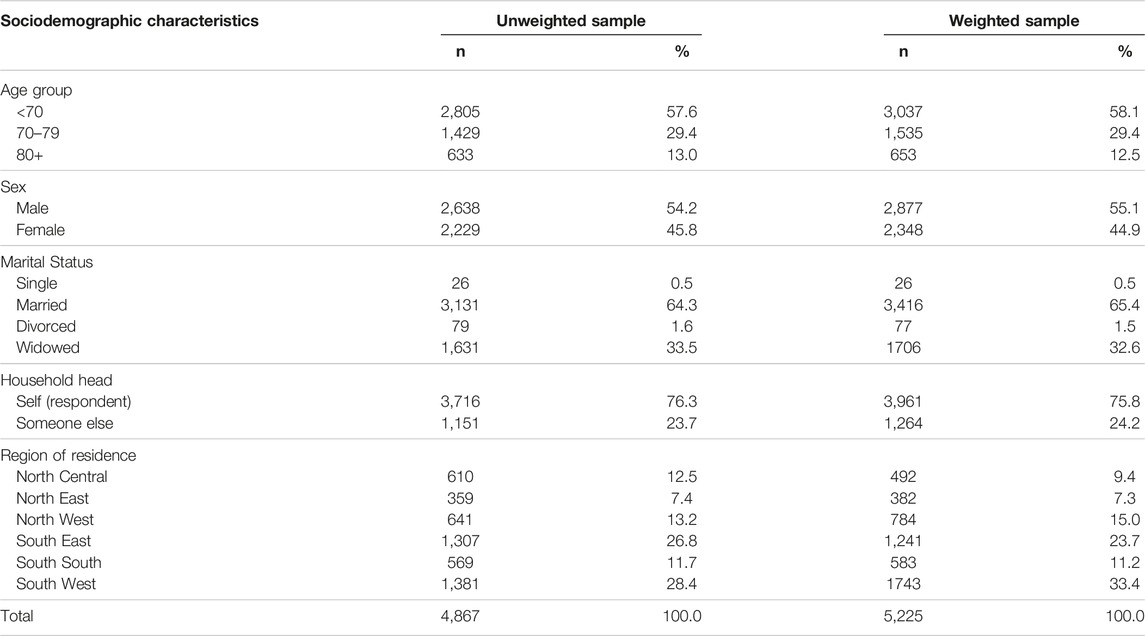
TABLE 2. Unweighted and weighted distribution of the respondents (Nigeria, 2023).
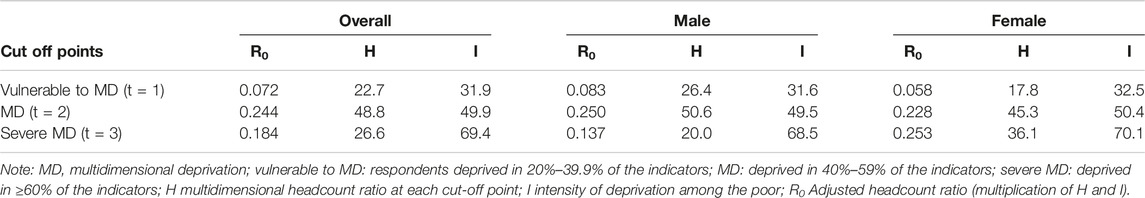
TABLE 3. Multidimensional deprivation index among older adults (Nigeria, 2023).
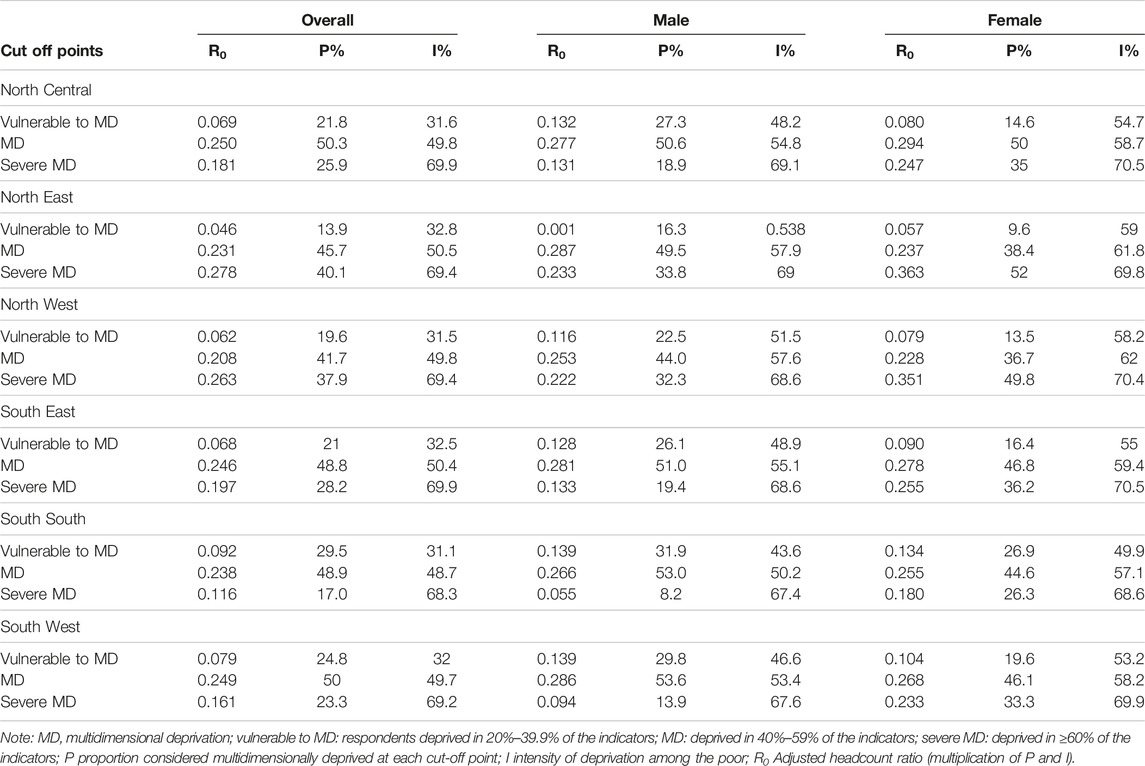
TABLE 4. Subnational decomposition of multidimensional deprivations among older adults (Nigeria, 2023).
In addition, the Intensity I of multidimensional deprivation which is the average share of deprivation among the poor is another measure of MD, based on Alkire and Foster’s formula
Where m is the weighted sum of the MD score as indicated in Eq. 1; t is the chosen MD threshold, d is the total number of dimensions being considered and p represents the incidence of deprivation at the target threshold as shown in Eq. 2. The formula in Eq. 3 above was used to estimate the intensity of MD among older persons in Nigeria at national and subnational levels and by gender.
The adjusted headcount ratio Ro was also estimated for various levels of multidimensional deprivation among older Nigerians. The Ro was obtained by the product of the headcount ratio and intensity of MD, as shown in Eq. 4 below.
Furthermore, the relative share of each multidimensional deprivation of each of the dimensions was also estimated at both national and subnational levels, and by gender.
Multilevel Multinomial Logistic Regression Model
The associated factors of multidimensional deprivation were examined using multilevel multinomial logistic regression (MMLR), encompassing both fixed-effect and random effects models. The outcome of an MMLR consists of k categories indexed using positive integers 1, 2, 3, … , k. Given the Generalized Bernoulli distribution of the outcome variable (multidimensional deprivation: no MD [k = 1], multidimensionally deprived [k = 2] and severe MD [k ≥ 3]) in this study, the probability of observing each category k is denoted as πk. Taking “k = 1” as the reference category to establish a baseline against which other categories are compared, the model comprises K − 1 equations that analyse and contrast the odds of exhibiting the category k instead of the reference category.
The MMLR model is a mixed Generalized Linear Model (GLM) with linear predictors [24], generally given by Eq. 5 below
and multinomial logit link of
Where k = 1, 2, … , K represent the categories of the outcome variable (multidimensional deprivation); j = 1, 2, … , J represent the cluster (community) and i = 1, 2, … , nj represent the respondents of the jth cluster.
Incorporating multilevel modelling into the multinomial logistic regression in Eqs 5, 6 allows variability in the probabilities of experiencing the k category across individuals. In each of the sub-equations, a random effect, represented by a varying intercept, is introduced. As described by Koster and McElreath [25], this varying intercept enables individuals to have either increased or decreased odds of being observed in category k relative to the reference category. The log-odds of ith individual experiencing other categories of K relative to the reference category is given as
Where
The above analytical approach was implemented by incorporating the logit link function of the GLM via the gsem Stata command. The analysis comprised four distinct nested models, including the empty model (comprising solely the outcome variable), model 1 (constructed solely with individual-level variables), model 2 (constructed solely with community-level variables), and model 3 (incorporating both individual and community-level variables). The optimal model selection for final result interpretation was determined through log-likelihood and Akaike’s information criteria.
The adjusted Relative Risk Ratio (RRR) with a 95% Confidence Interval (CI) was reported, and variables demonstrating a p-value of less than 0.05 in the multivariable analysis were identified as significant predictors of multidimensional deprivation (both for MD and severe MD). In random-effects analysis, the between-community variations in multidimensional deprivation were assessed using the Variance Partition Coefficient (VPC) otherwise referred to as Intraclass Correlation Coefficient (ICC) and Proportional Change in Variance (PCV). These measures provided insights into the extent of variation attributed to communities in the context of multidimensional deprivations.
Meanwhile, a multicollinearity test was conducted among explanatory variables using the Variance Inflation Factor (VIF). The results indicated the absence of multicollinearity, with VIF values ranging from 1.01 to 4.85 and a mean VIF of 2.35, except for a category of community-level poverty (VIF = 5.34). The recommended threshold for multicollinearity is a value greater than 5 to 10 [26, 27].
Results
The results in Table 2 show the unweighted and weighted distribution of older persons selected for this study. Based on the weighted sample, more than half of them were males (55.1%) and 60–69 years old (58.1%). Although nearly two-thirds were married, a substantial proportion of them were widowed (32.6%). At least three-quarters of the respondents were household heads. A higher proportion of the total weighted sample was selected from the South West (33.4%) and South East (23.7%) while North East (7.3%) and North Central (9.4%) were the least represented.
Based on the estimate of the multidimensional deprivation index of older persons in Nigeria, over 75% of older Nigerians living in urban areas are multidimensionally deprived, with 27% classified as being in severe multidimensional deprivation (Table 3). An additional 23% of the people, about 2 million older persons, were vulnerable to multidimensional deprivation. The intensity of deprivation, which is the average poverty score among the multidimensionally deprived, indicates that the severely deprived people are deprived in over 69% of the indicators while the multidimensionally deprived had an average of 50% deprivation score. The MDI, which is the proportion of the population that is multidimensionally deprived adjusted by the intensity of the deprivation, is 0.244 while for those severely deprived is 0.184.
More specifically, the majority of the older persons lived in unimproved houses (83%), with no access to electricity (77%), drinking unimproved water (71%), illiterate of the national official language of communication (76%), had no means of mobility (66%) with health challenge (60%). Just about half (52%) had below secondary education. Less than half of the respondents were deprived of other indicators (result not shown).
There are wide gender inequalities in multidimensional poverty levels in Nigeria. For instance, while only 20% of the older men were severely deprived with the intensity of 68%, over 36% of their women counterparts had the same severity of deprivation. Thus, the MDI for women (0.253) was almost double that of men (0.137).
The subnational decomposition of the analysis indicates that the share of older persons multidimensionally deprived in at least 40% of the indicators (t = 2) in some regions was higher than the national rate, especially the North East (86%) and the North West (80%) (Table 4). It was lowest in the South-South (66%). Those with severe multidimensional deprivations were highest in the two Northern regions–North East (40%) and North West (38%) and lowest in the South-South (17%) and South West (23%). In addition to the huge share of the urban-dwelling older persons in multidimensional deprivations, about 20%–22% are still vulnerable to deprivation across the regions, except the North East with the least (14%) and South-South with the highest (30%).
Across the regions, severe multidimensional deprivations were higher among older women than men. In the North East and North West in particular, about half of the women, 52% and 50% respectively, were severely deprived compared to men, 34% and 32% respectively. In the North Central and South East, the proportion of severely deprived women almost doubled that of men. Though women in the South-South and South West are not as severely deprived as their counterparts in other regions, the gender disparity is highest in the two regions, with over 150% and 220% higher share among women than men. However, more men are vulnerable to multidimensional deprivation than women.
Generally, of the five domains of deprivations, health (26.4%), education (25.1%) and living standard (22.2%) contributed the largest share to the multidimensional deprivations of older persons in Nigeria (Table 5). At the sub-national level, education had the largest share of multidimensional deprivation in the North East (30.3%) and North West (31.0%), while health had the largest share in the South-South (35.7%). Deprivation in information/communication was the least across the regions except in the South-South where education was the least in the arrays of older persons’ deprivations. From a gender perspective, overall, males were deprived most in health (29.4%) while women were deprived most in education (26.5%). This gender pattern is reflected at the sub-national level, except in the South-South where older males (38.2%) and females (32.8%) were more deprived of health than in any other dimension, and in the North West where both males (31.0%) and females (31.1%) were deprived most in education.
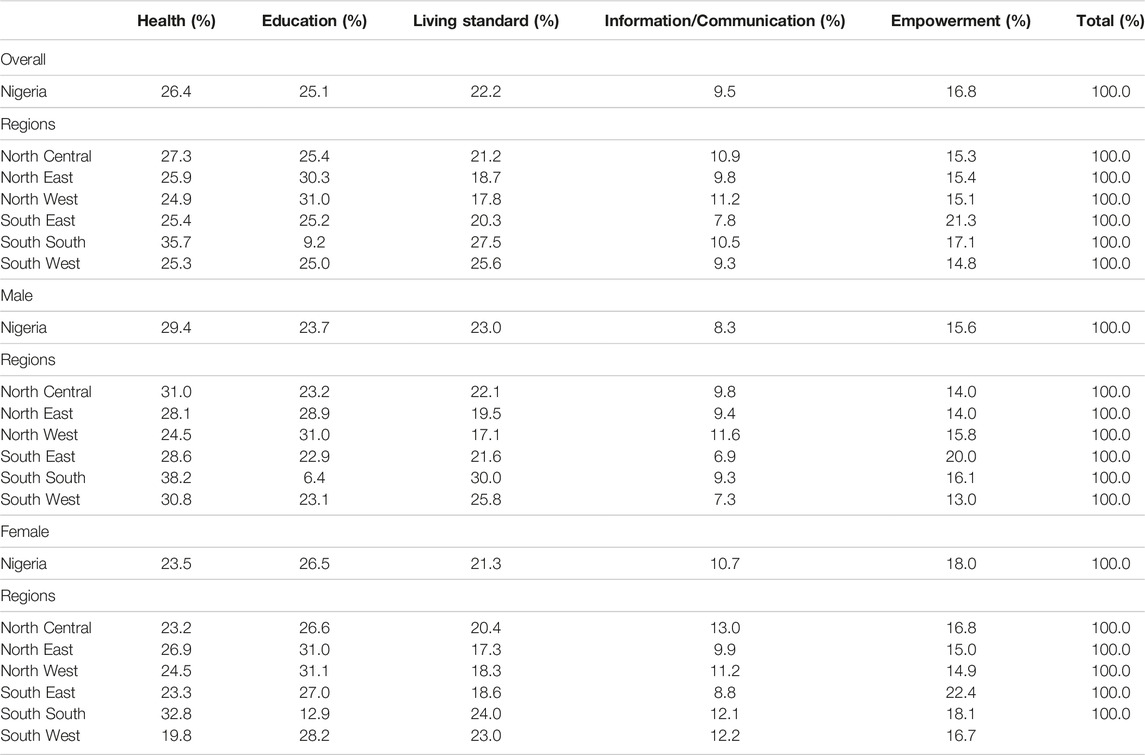
TABLE 5. Contribution of each domain to multidimensional deprivation index (R0) at national and subnational levels and by gender (Nigeria, 2023).
The results in Table 6 indicate the multilevel multinomial logistic regression estimates of individual-level and community-level factors associated with the risk of multidimensional deprivation among older persons in urban areas of Nigeria. The fixed-effect results indicate that respondents’ age, sex, and household headship were associated with their risk of multidimensional deprivation. For instance, the relative risk ratio (RRR) of being multidimensionally deprived was higher by 90%–143% for females (RRR = 1.90; p < 0.001; 95% C.I. = 1.56–2.31) compared to males, and for respondents of age 70–79 (RRR = 1.35; p < 0.01; 95% C.I. = 1.14–1.60) and age 80 or above (RRR = 2.43; p < 0.001; 95% C.I. = 1.83–3.24) compare to their counterparts below age 70 years (Model 1). However, the risk was about 30% lower for older persons living in households headed by someone else (RRR = 0.70; p < 0.001; 95% C.I. = 0.55–0.89) relative to older adults who were themselves the household heads. The associations were consistent when adjusted for other factors in Model 3. The associations between the individual-level factors and risk of severe MD were similar to those of MD. In addition, the gender of the household head was such that older persons living in female-headed households had a lower risk of severe MD, relative to their counterparts living in male-headed households.
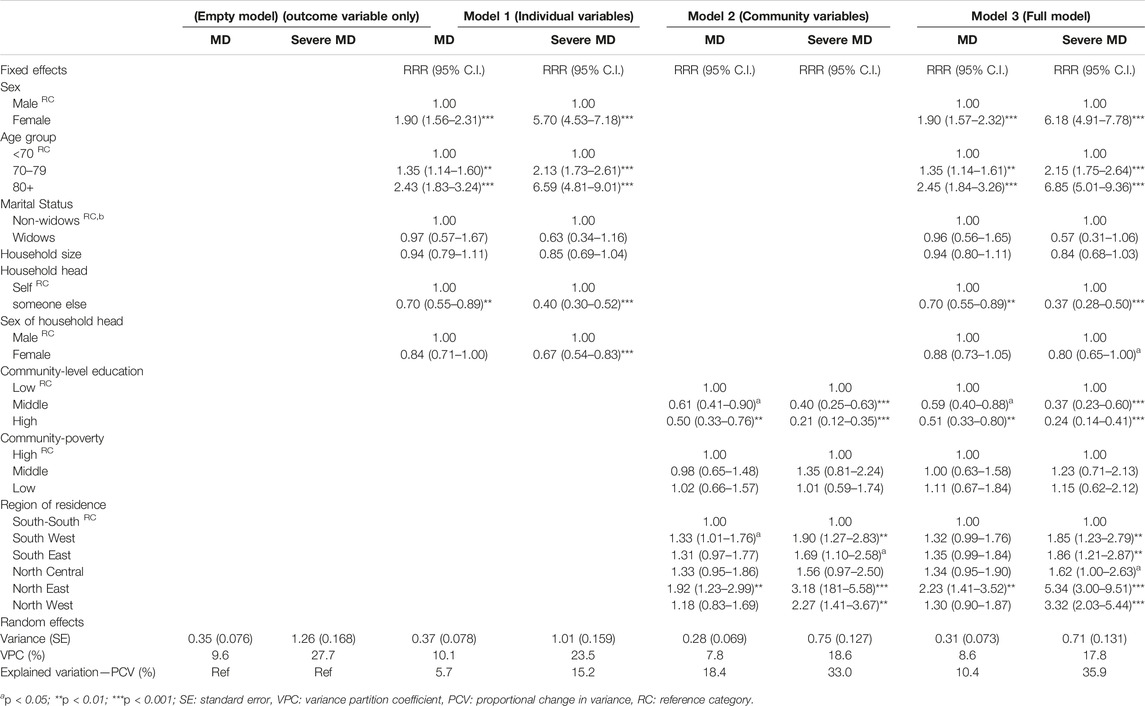
TABLE 6. Multilevel multinomial logistic regression of predictors of multidimensional deprivation among older persons in urban areas (Nigeria, 2023).
The result of the association between MD and community-level variables indicates that higher community-level education is significantly associated with a lower risk of MD and Severe MD in Models 2. As the community education level goes from low to high, the risk decreases. Also, the region of residence is a significant community-level factor contributing to the risk of MD among older persons in Nigeria. In Model 2, different regions show different risk levels. For instance, individuals from the South West and North East regions have a significantly higher risk of MD compared to the reference group (South-South). However, when adjusted for other factors in Model 3, only the North East showed a consistent association. For severe MD, all the regions except North Central had a higher risk compared to the reference group. The result was consistent and also included the North Central when adjusted for other factors in Model 3.
The result of the random effect indicated the variances attributable to the different nested levels in the model. The empty model which contains no explanatory variable indicated that between-communities variation, expressed as VPC, associated with the risk of severe MD (27.7%) was larger than between-community variation associated with the risk of MD (9.6%), and this gap was consistent across individual and community levels. The result further indicated that intra-community variation associated with the risk of MD and severe MD was estimated at 18.4% and 33.0% respectively (Model 2), and when adjusted for other factors was estimated at 10.4% and 35.9% respectively (Model 3). These results indicated that community-level factors account for a large proportion of the variation in the risk of multidimensional deprivations and severe multidimensional deprivations.
Discussion
Older people in low- and middle-income (LMIC) settings like Nigeria are increasingly at higher risk of poverty compared to other population groups. This is partly due to the prevailing economic crisis in the country. This study examines the level of MD and associated factors among older people in urban geographies of Nigeria. The findings from this study serve as a reference for developing community-based interventions to improve the welfare and wellbeing of older people in urban areas of the country.
The results presented in this study provide valuable insights into the MD experienced by older adults in the urban setting of LMIC, taking Nigeria as a case study. The findings reveal an alarming level of headcount MD among this population, with over 75% being multidimensionally deprived among which 27% were severely deprived. The rate among older persons implies that approximately seven million urban-dwelling older persons in Nigeria are experiencing severe deprivation across multiple dimensions. An additional 23% of older persons were vulnerable to multidimensional deprivation. This poses a big challenge to the wellbeing and quality of life of older people, indicating the extent of the problem and the need for urgent attention and targeted interventions to address various domains of deprivation. This level of MD is higher than the rate reported by the National Bureau of Statistics (NBS) for under-five children (70%), the highest rate among population groups in Nigeria [28]. It is also far higher than the prevalence in high-income countries like the United States [12] with a 12% prevalence, and some developing countries like Iran with a 59% prevalence [29]. Of all the dimensions considered, health (26%), education (25%) and standard of living (22%) contributed the largest share to the MD. The contributions of these indicators align with the 2015 AgeWatch index in which Nigeria was ranked one of the lowest globally in health index, level of education and socioeconomic situations of older persons [30].
The headcount and intensity of MD provide a more comprehensive insight into the condition of older persons in Nigeria, unlike other studies which have utilised only income or socioeconomic status to measure poverty among older people [4]. The intensity of deprivation among the severely deprived individuals, with an average deprivation score of over 69% of the indicators and among the multidimensionally deprived group, with an average deprivation score of 50%, is particularly of serious concern. It underscores the comprehensive nature of the deprivation experienced and reinforces the need for multifaceted interventions that address various dimensions of the deprivation simultaneously. Though a few existing studies in Nigeria have delved into poverty among older people [4, 31], none has indicated the extent of poverty among the poor, as revealed in this study.
The study also reveals significant gender inequalities in multidimensional poverty levels among older adults in Nigeria. Women, in particular, face higher levels of severe deprivation compared to men, with the MDI for women almost double that of men. This disparity reflects women’s limited access to education, lower levels of participation in household economic and health decision-making, and limited access to employment opportunities [22]. The gender disparity is evident across various regions, with Northern women experiencing the worst condition of severe MD. This highlights the need for gender-sensitive interventions to address the specific challenges faced by older women in accessing resources and opportunities.
Furthermore, this study finds that living in a household headed by someone else, especially by a family member, protects older persons from MD. Although being a household head could give older persons some authority over household members and resource allocation [32], this benefit is conditional on the availability of resources, the extent of affinity, sense of responsibility and reciprocity, and the functional ability of the household head. Thus, older persons living in households headed by a younger, economically active and financially buoyant family member are more likely to have access to information, communication and companionship, healthcare support and quality living standards, compared with those with otherwise living arrangements. However, if the household is headed by the spouse, it may not benefit some older women who are economically vulnerable and marginalised in household headship and resource sharing in a patriarchal society [33, 34].
The subnational decomposition analysis provides further valuable insights into the regional disparities in multidimensional deprivation. The North East and North West regions exhibit higher rates of deprivation, with a significant proportion experiencing severe deprivation. The two regions have often shown the worst case of many socioeconomic and health indicators including the level of education, healthcare service utilisations, unemployment, multidimensional deprivations in general and sub-groups of the population [22, 28, 35]. The situation in Northern regions may also be linked to the women’s low level of education, restriction in some public spaces and economic activities, and culturally laden norms that limit women’s economic and social power in the regions [36]. On the other hand, the South-South region, though with a lower level of headcount MD, reports the highest vulnerability to multidimensional deprivation. These regional variations emphasize the importance of tailoring interventions to address the unique challenges and context of each region, considering factors such as socioeconomic conditions, healthcare infrastructure, and cultural factors.
The multilevel regression analysis identifies individual-level and community-level factors associated with the risk of multidimensional deprivation among urban-dwelling older persons in Nigeria. This study found that the age of the respondents was a major individual-level factor influencing the risk of multidimensional deprivation. In particular, older persons, especially women, face a higher risk of multidimensional deprivations. This finding may be because individuals at advanced ages are more vulnerable to poverty due to their reduced participation in economic activities coupled with caregivers’ financial incapacity [37, 38] and poor socioeconomic conditions in the country [39]. However, the finding contrasts the that of Dhongde [40] who linked lower multidimensional deprivation to older age. This disparity may be because Dhongde’s evidence was based on a high-income context.
The study, however, found that those living in communities with high levels of education experience a lower risk of deprivation. These findings underscore the importance of not only considering individual characteristics but also recognizing the broader context of the community when addressing health outcomes. This has implications for designing interventions and policies that aim to reduce the prevalence of severe MD. Meaning impact could be achieved when community-level factors are given the necessary focus.
Potential Health Implications
The findings of this study have significant health implications. The huge proportion of multidimensional deprivations suggests that a significant portion of older adults lack access to essential elements of wellbeing, including health services, education, standard living conditions, and social support. Specifically, individuals with deprivation in the health domain, for instance, are liable to functional limitations which can be worsened in the absence of relevant support [40]. This potentially increases older people’s risk of hospitalisation and health expenditure. A similar implication is inferable for education, as more than half of older persons are uneducated and will be susceptible to adverse health outcomes associated with a low level of education. Also, living arrangements, access to information and communication devices are key indicators of information and communication in this study. Older persons living alone are at risk of loneliness and depression [41]. In the same vein, lack of access to information, either from radio, television or mobile phones, results in a lack of access to health information which has implications for older persons who need regular healthcare services. Poor standard of living puts older people at risk of exposure to infectious diseases amidst their declining immunity.
The gender disparities also stress the need for gender- and situation-specific interventions to improve the health and overall wellbeing of older adults, especially women, in urban areas. Furthermore, from a community-level point of view, structural inequalities need to be addressed to enhance the health outcomes of older populations, promote equitable access to healthcare, and improve their overall quality of life.
Limitations to the Study
The study utilized a cross-sectional design, which limits its ability to establish causal relationships. Longitudinal data would be necessary to better understand the dynamics of multidimensional deprivation over time. Besides, variables and measures in this study were adapted to the extent of data availability; thus, it might not fully capture all dimensions of multidimensional deprivation that could be relevant to the older population. However, the dimensions and indicators used are comprehensive and arguably cover the major socioeconomic and health concerns of older persons. The construction of the multidimensional deprivation index involved assigning weights to indicators. Though different weighting methods could lead to different conclusions, I do not envisage any major difference in the conclusions. Also, the choice of a cut-off value (40%) to define multidimensional deprivation was based on considerations for poverty levels tolerable in an LMIC context, but different cut-off points could yield different estimates of deprivation. However, divergent estimates do not in any way invalidate the estimate of this study, as long as it is interpreted within its premised assumptions. This study focused on urban areas, which might limit the generalizability of the findings to rural settings or other countries with different contexts and socioeconomic conditions.
Conclusion
This study indicates an alarming prevalence of multidimensional deprivations among urban-dwelling older adults in Nigeria, though gender disparities are evident, with women more severely deprived. It highlights that the deprivations were driven, not only by individual factors but also by community-level factors, including education and region of residence. The findings of this study underscore the urgent need for comprehensive and targeted policy interventions to address the multidimensional deprivation faced by older adults in urban Nigeria. These interventions should prioritize addressing gender disparities, targeting regions with high deprivation rates, and considering individual and community characteristics. By addressing the underlying determinants of multidimensional deprivation and promoting health equity, policymakers and stakeholders can work towards improving the wellbeing and quality of life for older adults in urban Nigeria.
Ethics Statement
This study involves humans and utilized secondary data of the Demographic and Health Survey (DHS) program being coordinated by ICF International. To utilize the data for this study, written approval was obtained from ICF International. The DHS protocol was approved by the National Health Research Ethics Committee of Nigeria (NHREC) and the ICF Institutional Review Board (IRB). The survey was conducted in accordance with the local legislation and institutional requirements. The participants provided their written informed consent to participate in the survey, and IRB-approved protocol for the DHS public-use datasets do not in any way identify the participating respondents, households, or sample communities.
Author Contributions
JM is the sole author of this manuscript from conceptualization to method, analysis, results, discussion and conclusion.
Funding
This study did not receive any direct funding from any source. However, the author acknowledges the support of the Consortium for Advanced Research Training in Africa (CARTA). CARTA is jointly led by the African Population and Health Research Center and the University of the Witwatersrand and funded by the Carnegie Corporation of New York (Grant No. G-19-57145), Sida (Grant No: 54100113), Uppsala Monitoring Centre, Norwegian Agency for Development Cooperation (Norad), and by the Wellcome Trust [reference no. 107768/Z/15/Z] and the UK Foreign, Commonwealth & Development Office with support from the Developing Excellence in Leadership, Training and Science in Africa (DELTAS Africa) programme.
Conflict of Interest
The author declares that they do not have any conflicts of interest.
References
1. Ottong, J. Population, Age and Sex Distribution: Population of Nigeria (2012). Available from: https://www.onlinenigeria.com/links/adv.asp?blurb¼549 (Accessed September 27, 2022).
2. United Nations. Population Ageing 2006. New York, NY: Department of Economics and Social Affairs. Population Division. ST/ESA/SER.A/251 (2006). Available from: https://www.un.org/esa/socdev/ageing/documents/ageing2006chart.pdf (Accessed September 27, 2022).
3. Federal Government of Nigeria. FG Approves National Policy on Ageing for Older Persons in Nigeria (2021). Available from: https://fmic.gov.ng/fg-approves-national-policy-on-ageing-for-older-persons-in-nigeria/#:∼:text=Theapprovalwasgivenon,%2Cself-fulfillmentanddignity (Accessed February 11, 2021).
4. Adisa, O. Why Are Some Older Persons Economically Vulnerable and Others Not ? The Role of Socio-Demographic Factors and Economic Resources in the Nigerian Context. Aeing Int (2019) 44:202–22. doi:10.1007/s12126-019-09348-8
5. United Nations. Transforming Our World: The 2030 Agenda for Sustainable Development. New York: Department of Economic and Social Affairs Population Division, United Nations (2015). A/RES/70/1. Available from: https://sustainabledevelopment.un.org/content/documents/21252030%20Agenda%20for%20Sustainable%20Development%20web.pdf (Accessed September 27, 2022).
6. Alkire, S, Kanagaratman, U, and Suppa, N. The Global Multidimensional Poverty Index (MPI) 2021: 2018 Revision. In: OPHI MPI Methodological Note 51. Oxford, United Kingdom: Oxford Poverty and Human Development Initiative, University of Oxford (2021).
7. United Nations Development Programme, Oxford Poverty and Human Development Initiative. Charting Pathways Out of Multidimensional Poverty: Achieving the SDGs. Oxford, United Kingdom: United Nations Development Programme (2020). Available from: http://hdr.undp.org/sites/default/files/2020_mpi_report_en.pdf (Accessed February 20, 2023).
8. Alkire, S, and Foster, J. Counting and Multidimensional Poverty Measurement. J Public Econ (2011) 95(7–8):476–87. doi:10.1016/j.jpubeco.2010.11.006
9. Hu, Y, Han, H, and Liu, P. Reducing Multidimensional Poverty of Elderly: The Role of the New Rural Pension Scheme in China. Discret Dyn Nat Soc (2022) 2022:1–16. doi:10.1155/2022/4533075
10. Ku, I, and Kim, CO. Decomposition Analyses of the Trend in Poverty Among Older Adults: The Case of South Korea. Journals Gerontol - Ser B Psychol Sci Soc Sci (2020) 75(3):684–93. doi:10.1093/geronb/gby047
11. Yun, S, and Ko, K. Multidimensional Elderly Poverty index. Sejong City, Korea: Korea Institute for Health and Social Affairs (2018). Hanguk Pogon Sahoe Yonguwon Available from: http://www.kihasa.re.kr (Accessed February 26, 2023).
12. Dhongde, S. Assessing Multidimensional Deprivation Among the Elderly in the USA. In: R White, editor. Measuring Multidimensional Poverty and Deprivation, Global Perspectives on Wealth and Distribution. Cham: Palgrave Macmillan (2017). p. 255–70.
13. Norris, P. Making Democratic Governance Work: How Regimes Shape Prosperity, Welfare, and Peace. England, United Kingdom: Cambridge Univ Press (2012). doi:10.1017/CBO9781139061902
14. Mcferson, HM. Poverty Among Women in Sub-Saharan Africa: A Review of Selected Issues. J Int Womens Stud (2010) 11(4):50–72. Available from: http://vc.bridgew.edu/jiws/vol11/iss4/4 (Accessed November 14, 2023).
15. Akinyemi, AI, Mobolaji, JW, Abe, JO, Ibrahim, E, and Ikuteyijo, O. Women Deprivation Index and Family Planning Utilisation in Urban Geography of West African Countries. Front Glob Women’s Heal (2021) 2(6):656062. doi:10.3389/fgwh.2021.656062
16. Momoh, J, Opaluwah, A, and Albeera, H. Challenges Facing Nigeria’s Urban Environment: The Abuja Case. J Sustain Dev Africa (2018) 20(2):34–49.
17. Akinyemi, AI, Ikuteyijo, OO, Mobolaji, JW, Erinfolami, T, and Adebayo, SO. Socioeconomic Inequalities and Family Planning Utilization Among Female Adolescents in Urban Slums in Nigeria. Front Glob Women’s Heal (2022) 3:838977. doi:10.3389/fgwh.2022.838977
18. Cities Alliance. Connecting Systems of Secondary Cities. Brussels: Cities Alliance/UNOPS (2019). Available from: https://www.citiesalliance.org/sites/default/files/2019-07/CA_ConnectingSystems_Web_FINAL%281%29_0.pdf (Accessed May 26, 2021).
19. Turgel, I, and Bozhko, L. Secondary Cities in Emerging Market Countries: New Trends and Challenges. In: 5th International Multidisciplinary Scientific Conference on Social Sciences and Arts SGEM; 23 - 26 October, 2018; Florence, Italy (2018). p. 191–6.
20. Cities Alliance. Secondary Cities Are a Vital Part of National and Regional Economic Development. Brussels, Belgium: Cities Alliance (2014).
21. South African Cities Network. Secondary Cities in South Africa: The Start of a Conversation Background Report. South Africa (2012). Available from: http://sacitiesnetwork.co.za/wp-content/uploads/2014/07/secondary_cities_in_south_africa_with_more_detail.pdf (Accessed May 26, 2021).
22. National Population Commission (NPC) [Nigeria] and ICF. Nigeria Demographic and Health Survey 2018. Abuja, Nigeria, and Rockville, Maryland, USA: NPC and ICF (2019).
23. Adetola, A, and Olufemi, P. Determinants of Child Poverty in Rural Nigeria: A. Glob J Hum Soc Sci Arts Humanit (2012) 12(12):1–17.
24. Grilli, L, and Rampichini, C. A Multilevel Multinomial Logit Model for the Analysis of Graduates’ Skills. Stat Methods Appl (2007) 16(3):381–93. doi:10.1007/s10260-006-0039-z
25. Koster, J, and McElreath, R. Multinomial Analysis of Behavior: Statistical Methods. Behav Ecol Sociobiol (2017) 71(9):138. doi:10.1007/s00265-017-2363-8
26. Aragaw, A, Azene, A, and Workie, M. Poisson Logit Hurdle Model With Associated Factors of Perinatal Mortality in Ethiopia. J Big Data (2022) 9(16):16. doi:10.1186/s40537-022-00567-6
27. Kim, J. Multicollinearity and Misleading Statistical Results. Korean J Anesthesiol (2019) 72(6):558–69. doi:10.4097/kja.19087
29. Alkire, S, Basakha, M, and Mohaqeqi Kamal, SH. Multidimensional Poverty Index: A Multilevel Analysis of Deprivation Among Iranian Older Adults. Ageing Soc (2022) 2022:337–56. doi:10.1017/s0144686x2200023x
30. HelpAge International. Global AgeWatch Index 2015: Insight Report. London: HelpAge International (2015). Available from: https://www.helpage.org (Accessed March 20, 2018).
31. Eme Ichoku, H, Fonta, W, and Thiede, M. Socioeconomic Gradients in Self-Rated Health: A Developing Country Case Study of Enugu State, Nigeria. Econ Chang Restruct (2011) 44(3):179–202. doi:10.1007/s10644-010-9098-0
32. Mobolaji, J, and Akinyemi, AI. Complementary Support in Later Life: Investigating the Gender Disparities in Patterns and Determinants Among Older Adults in South-Western Nigeria. BMC Geriatr (2022) 25:704–9. doi:10.1186/s12877-022-03393-w
33. Omowumi, BE, Taiwo, PA, and Olaotan, SY. Old People’s Well-Being in a Total Institution and the Imperative of New Policy Directives. Afr J Psychol Stud Soc Issues (2016) 19(2):12–27.
34. Bloom, DE, Jimenez, E, and Rosenberg, L. Social Protection of Older People. USA: Havard university (2011). (PGDA Working Paper No. 83). Available from: http://www.hsph.harvard.edu/pgda/working.htm (Accessed September 6, 2023).
35. Okoli, C, Hajizadeh, M, Rahman, MM, and Khanam, R. Geographical and Socioeconomic Inequalities in the Utilization of Maternal Healthcare Services in Nigeria: 2003-2017. BMC Health Serv Res (2020) 20(1):849. doi:10.1186/s12913-020-05700-w
36. Ogbe, A. The Travails of Women and Girls in Northern Nigeria: A Human Rights Issue. SSRN Electron J (2020) 11:1–14. doi:10.18192/potentia.v11i0.4662
37. Akinyemi, A, and Akinlo, A. Unmet Needs for Care and Support for the Elderly in Nigeria: Gaps in Experiences and Expectations of the Aged in Ilesa, South-West Nigeria. Niger J Sociol Anthropol Spec Ed Ageing Niger (2014) 12(1):28–43. doi:10.36108/njsa/4102/12(0120)
38. Aboderin, I. Decline in Material Family Support for Older People in Urban Ghana, Africa: Understanding Processes and Causes of Change. J Gerontol Soc Sci (2004) 59B(3):S128–37. doi:10.1093/geronb/59.3.s128
39. Oladele Akinbode, S, and Elizabeth Ojediran, F. Multidimensional Poverty Among Households in Southwest Nigeria. J Econ Dev (2018) 48–67. doi:10.33301/jed-p-2018-20-01-03
40. Dhongde, S. Multidimensional Economic Deprivation During the Coronavirus Pandemic: Early Evidence From the United States. PLoS One (2020) 15(12):e0244130. doi:10.1371/journal.pone.0244130
Keywords: older adults, multidimensional deprivation, poverty, standard of living, socioeconomic status, multilevel analysis
Citation: Mobolaji JW (2024) Multidimensional Deprivations and Associated Factors Among Older Adults in Urban Geographies of Nigeria: Implications for Poor Health Outcomes in Later Life. Int J Public Health 69:1606572. doi: 10.3389/ijph.2024.1606572
Received: 01 September 2023; Accepted: 28 February 2024;
Published: 13 March 2024.
Edited by:
Stephen Ojiambo Wandera, Makerere University, UgandaReviewed by:
Patricio Valenzuela, University of the Andes, Chile, ChileOne reviewer who chose to remain anonymous
Copyright © 2024 Mobolaji. This is an open-access article distributed under the terms of the Creative Commons Attribution License (CC BY). The use, distribution or reproduction in other forums is permitted, provided the original author(s) and the copyright owner(s) are credited and that the original publication in this journal is cited, in accordance with accepted academic practice. No use, distribution or reproduction is permitted which does not comply with these terms.
*Correspondence: Jacob Wale Mobolaji, bW9ib2xhd2FsZUBnbWFpbC5jb20=, am1vYm9sYWppQG9hdWlmZS5lZHUubmc=
This Original Article is part of the IJPH Special Issue “Ageing and Health in Sub-Sahara Africa”