 Irene Marcilla-Toribio1,2,3†
 Bruno Bizzozero-Peroni1,4*†
 Blanca Notario-Pacheco1,2,5†
 Shkelzen Cekrezi1†
 Martin Fernandez-Perez6†
 Ana Perez-Moreno1†
 Ana Diez-Fernandez1,2†
 Maria Martinez-Andres1,2,3†
- 1Health and Social Research Centre, Universidad de Castilla-La Mancha, Cuenca, Spain
- 2Research Group Health, Gender, and Social Determinants, Instituto de Investigación Sanitaria de Castilla-La Mancha (IDISCAM), Cuenca, Spain
- 3Faculty of Nursing, Universidad de Castilla-La Mancha, Albacete, Spain
- 4Higher Institute of Physical Education, Universidad de la República, Rivera, Uruguay
- 5Faculty of Nursing, Universidad de Castilla-La Mancha, Cuenca, Spain
- 6Fundación Biomédica Galicia Sur, Grupo I-Saúde, Vigo, Spain
Objectives: We aimed to quantify the relationships of surrounding residential greenness with abdominal obesity and dyslipidemia.
Methods: A systematic search was conducted in January 2024 through 5 electronic databases including Pubmed, Scopus, Web of Science, and CINHAL (Complete and GreenFILE). The DerSimonian and Laird method was used to calculate the pooled odds ratios (ORs) and their respective 95% confidence intervals (CIs). The study protocol was registered in PROSPERO (CRD42024528548).
Results: Eleven cross-sectional studies involving 564,254 individuals with a mean age of 55.95 years were included. A significant inverse relationship was observed between increased surrounding greenness and lower odds of abdominal obesity (OR: 0.80; 95% CI: 0.70–0.91), elevated TG (OR: 0.97; 95% CI: 0.96–0.97), and low HDL-C levels (OR: 0.98; 95% CI: 0.95–1.00).
Conclusion: Abdominal obesity and elevated triglyceride levels could be reduced in the general adult population by increasing residential greenness. These findings underscore the importance of integrating greenness into urban planning and public health policies to promote healthier environments. Interventions such as the development of urban green spaces could play a crucial role in reducing cardiometabolic risk factors.
Systematic Review Registration: https://www.crd.york.ac.uk/prospero/display_record.php?ID=CRD42024528548
Introduction
Urbanization is rapidly increasing globally. Currently, over half of the worldwide population resides in urban environments, a figure projected to increase to 60% by 2030 [1–3]. This phenomenon has resulted in a significant increase in the number of individuals residing in areas characterized by air pollution, noise, and a reduction in green space [4–6]. Indeed, changes in urban design have been suggested with a focus on the concept of “healthy cities” to improve population health. Green spaces are one of the important pillars of this new and innovative approach [7, 8], constituting a fundamental component of the Sustainable Development Goals outlined within the World Health Organization’s 2030 Agenda [9].
The urban environment has been identified as a key health determinant as its influence on human health [10], improving outcomes in mental health, maternal and child health and cardiovascular health between others [11–13]. Adults are particularly impacted by urban environments context, as they have the agency to choose how and whether to engage with green spaces. The interaction in this context underscores the significance of study this population to better understand how these spaces can promote health and wellbeing [11, 12]. Moreover, it seems that women may benefit slightly more from greenery than men [14, 15]. In addition, socioeconomic status plays a key role in the relationship between urban greenness and health benefits. Previous studies have indicated that people with higher socioeconomic status tend to have greater access to green spaces, which may favors healthier lifestyles, such as greater physical activity levels [16–18]. However, proximity to urban vegetation may also be particularly beneficial for individuals from lower socioeconomic backgrounds, who often face higher cardiovascular risk due to inequalities in access to health resources and less favorable lifestyles [17–19].
Cardiovascular disease (CVD) represents a significant global public health concern. In 2019, circulatory system diseases were the leading cause of mortality worldwide, accounting for 32% of all deaths [20]. Additionally, it is estimated that by 2030, the number of deaths from cardiocirculatory disease will reach 23.6 million per year [20]. Risk factors for CVD include hypertension, smoking, diabetes, obesity, physical inactivity, and unhealthy diets [21, 22]. Adiposity, in particular, is a significant risk factor of the development of this condition [23, 24] which can be objective and easily quantifiable by waist circumference and blood lipids parameters such as total cholesterol (TC), triglycerides (TG), low-density lipoprotein cholesterol (LDL-C), and high-density lipoprotein cholesterol (HDL-C) [25–28].
Residential greenness can be objectively measured. The Normalized Difference Vegetation Index (NDVI) is a widely used numeric measure of vegetation which is effective in quantifying its health and density [29]. This index has been used in several studies related to public health, as a greater presence of green areas has been associated with benefits for people’s health [11, 12, 30]. The NDVI’s widespread use is due to its ability to provide objective, reliable and easily interpretable information on the state of vegetation, making it a valuable and indispensable tool for both ecological monitoring and health research [30, 31].
The association between green spaces and obesity has been studied. However, the main focus has been on body mass index (BMI) or CVD mortality, and the findings are inconclusive regarding the amount and type of green space needed to reach health benefits [32]. Consequently, it is imperative to acknowledge that there are still aspects that require further investigation. Particularly, studies focusing on waist circumference and blood lipids levels, which are a more specific marker of body fat distribution and CVD risk factors [33, 34].
Our study is the first meta-analysis to examine the relationship between proximity to urban greenness and its specific influence on waist circumference and individual blood lipid markers (cholesterol, HDL, LDL, and triglycerides) in adults. While previous research has highlighted the general health benefits of urban greenness, no study has comprehensively quantified its associations with these cardiometabolic risk factors. By addressing this gap, our findings provide novel insights into the potential mechanisms through which urban green spaces can support chronic disease prevention and cardiovascular mortality risk reduction.
Therefore, the main aim of this systematic review and meta-analysis was to quantify the relationships of surrounding residential greenness with abdominal obesity and dyslipidemia in adults. In addition, the possible influence of sociodemographic variables, such as sex and socioeconomic status, on this relationship was also explored.
Methods
Design
This systematic review and meta-analysis was conducted according to the Meta-analysis of Observational Studies in Epidemiology (MOOSE) statement [35] and was performed following the recommendations of the Cochrane Collaboration Handbook [36]. The study protocol was registered in PROSPERO (CRD42024528548).
Search Strategy
A systematic search for studies was conducted through 5 electronic databases including Pubmed, Scopus, Web of Science, and CINHAL (Complete and GreenFILE). The search was conducted from inception until 19th January 2024. The following free terms combined with Boolean operators were used following the PECO (Population, Exposure, Comparison, Outcome) strategy [37]: [(“adults”) AND (“greenness” OR “green space” OR greenery OR “residential greenness” OR “urbanization” OR neighborhood OR “NDVI”) AND (“waist circumference” OR “abdominal obesity” OR “cardiometabolic risk” OR adiposity OR “body fat” OR “body composition” OR “fat mass” OR “lean mass” OR “visceral fat” OR “cholesterol” OR “blood lipid”)]. No filters were used. No temporal restrictions were applied during the search of the literature.
In the course of the identification, selection and exclusion of relevant articles, the Zotero software [38] was employed for the management of bibliographic references. This software facilitated the efficient organization of references obtained through literature searches, as well as the review and selection of articles. Zotero also assisted in the management of citations and the maintenance of a clear record of the articles included and excluded at each stage of the process, which was essential to ensure the transparency and reproducibility of the methodology.
Selection Criteria and Data Extraction
In this systematic review and meta-analysis, two independent researchers (IM-T and MM-A) screened the articles by title and abstract before coming to a consensus opinion to determine whether studies should be included. To be included, the retrieved studies from the peer-reviewed literature had to meet the following inclusion criteria: i) Population: General adult population; ii) Exposure: Residential greenness measured from each participant’s postal address using the NDVI index as continuous data to avoid heterogeneity introduced by categorization [36]; iii) Outcome: Studies that investigated waist circumference as adiposity parameter, and TC, TG, LDL-C, and HDL-C as blood lipid parameters, using consistent and comparable units of measurement; iv) Design: cross-sectional studies were included. Conference abstracts, commentaries, editorials, or dissertations were excluded. Furthermore, articles written in languages other than English or Spanish were excluded based on the authors’ language proficiency and the restricted availability of translation resources. In the event of any discrepancies, the eligibility of studies were resolved by consensus or with the involvement of a third researcher (B.B-P).
The information extracted from the selected articles was the following: authors and year of publication, country in which data were collected, sample size, female percentage, mean age, mean BMI, NDVI exposure definition, NDVI increment unit, NDVI mean, adiposity and dyslipidemia outcomes, outcome units, outcome cut-off points, statistics including odds ratios (95% CI), and covariate adjustments.
Exposure
NDVI [39]: this index is employed to measure and monitor vegetation on the earth’s surface by analyzing satellite images. It is based on the difference between the red and near-infrared bands of the electromagnetic spectrum, taking advantage of the fact that vegetation strongly absorbs red light for photosynthesis and reflects near-infrared light. The NDVI index takes values between −1 and 1. Positive values indicate the presence of vegetation, with values close to 1 indicating dense and healthy vegetation. Conversely, negative values or values close to zero indicate the absence of vegetation or non-vegetated surfaces such as water, snow, or bare soil [40].
Outcomes
Waist circumference [27]: this measurement is an anthropometric assessment employed to evaluate the distribution of adipose tissue and the risk of metabolic disorders, including cardiovascular disease. This measure also is designed to indicate abdominal obesity, and particularly, it appears to be a more specific marker of body fat distribution, in comparison to body mass index [41]. The waist circumference is typically taken around the narrowest portion of the torso, typically situated just above the navel. In addition, waist and hip circumferences can be used to calculate another anthropometric measure of adiposity, the waist-hip ratio [42]. These outcomes were analyzed as categorical data in accordance with the cut-off point employed by each study to define an increased risk of abdominal obesity.
Blood lipids [43]: these are fat molecules that circulate in the bloodstream. An excess of these molecules can accumulate on the walls of arteries, forming plaques. These plaques can impede blood flow and increase the risk of cardiovascular events. The main types of blood lipids include TC, TG, LDL-C and HDL-C, and if one or more of the values established as appropriate exceeds the threshold, dyslipidemia is considered to be present [44, 45]. The blood lipid outcomes were analyzed as categorical variables according to the cut-off points employed by the included studies to define high cholesterol, triglycerides and LDL-C levels, and low HDL-C levels.
To determine the socio-economic status of participants, an approach based on their reported monthly income was used.
Methodological Quality Assessment
The Quality Assessment tool for Observational Cohort and Cross-Sectional studies from the National Heart, Lung and Blood Institute [46] was employed to assess the methodological quality of the included studies. The assessment of methodological criteria was conducted regarding the following domains: quality of the research question, reporting of the population definition, participation rate, recruitment, sample size, appropriateness of statistical analyses, timeframe for associations, exposure levels, ascertainment of the exposure, appropriateness of the outcome measured, outcome blinding of researchers, loss to follow-up, and confounding variables. The quality assessment of the included articles was evaluated by two independent researchers (I.M-T and M.M-A). Any discrepancies were resolved through consensus or, if necessary, with the involvement of a third researcher (B.B-P).
Data Analysis
Odds ratios (ORs) and their respective 95% confidence intervals (95% CI) were extracted from the fully adjusted model to estimate the associations between increased NVDI values and the odds of adverse adiposity and blood lipid parameters. This meta-analysis applied a random-effects model to combine the ORs from the included studies and the DerSimonian and Laird method [47] was used to compute the between-study variance. Additionally, a prediction interval for the overall effect was calculated based on the t-distribution with 4 degrees of freedom. This interval provides an estimate of the range within which the true effect size of a new study is expected to fall, accounting for both within-study and between-study variability [48]. Heterogeneity was also examined using the I2 statistic, which ranges from 0% to 100%. Based on the I2 values, heterogeneity was classified as having no important effect (0%–30%), a moderate effect (30%–60%), a substantial (60%–75%) effect, or a considerable effect (75%–100%) [49]. The p values were also considered for the assessment of heterogeneity (when p < 0.05, heterogeneity was identified).
Other methodological considerations for data collection and analysis should be detailed. In order to prevent over-representation, the pooled OR was estimated in those studies that provided multiple data points per residential buffers [50–55]. Subsequently, a single data set was utilized for each study exhibiting this specificity. In studies in which β coefficient and its CI were reported [56] the OR (95% CI) was estimated by calculating the exponential of β. Furthermore, in studies that provided results on the odds of adverse outcomes according to higher NDVI values only graphically [56, 57], data were extracted using WebPlotDigitizer software [58].
Subgroup analyses were conducted according to sex (male and female) and socioeconomic status (lower and upper), if possible. Residential buffer zones (100 m, 250 m, 300 m, 400 m, 500 m, 800 m, 1,000 m, 1,500 m, and 1,250 m) analyses were also performed.
All statistical analyses were conducted using R software (Foundation for Statistical Computing, V.2023.12.1 + 402, Boston, MA, United States) [59].
Results
Baseline Characteristics
The systematic search identified a total of 3,716 published articles. Of these, 1,069 (29%) duplicate publications were removed, thus leaving 2,647 (71%) potentially eligible articles, which were extracted to review the title and abstract, following the inclusion and exclusion criteria. Of the 2,647 articles, 2,582 (98%) were excluded, with 65 (2%) articles finally selected for full-text reading to verify their eligibility. References to the excluded full-text articles are available in the Supplementary Material. Finally, 11 (17%) studies [50–57, 60–62] were included in this systematic review and meta-analysis (Figure 1).
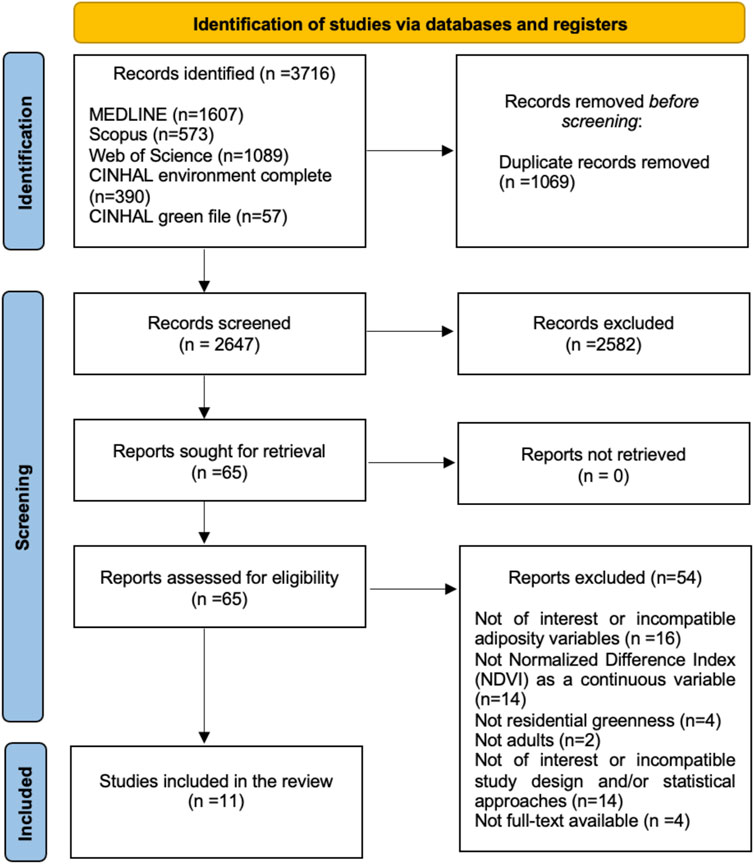
Figure 1. PRISMA flowchart of the stepwise assessment of articles obtained from the search strategy (worldwide, 2017–2023).
The characteristics of each of the studies are detailed in Table 1; Supplementary Material. All studies were cross-sectional and published between 2020 and 2023. Seven studies addressed the waist circumference measured in centimeters (cm) [51, 52, 55, 56, 60–62], and five addressed blood lipids measured in millimoles per liter (mmol/L) [50, 52–54, 57]. Regarding the independent variable, residential greenness, all studies quantified it objectively through the NDVI index. The NVDI increment units and cut-off points for determining the adverse adiposity and blood lipid parameters applied by each study are detailed in Table 1. Of these studies, one was done in Canada [61], one in Spain [62], one in the UK [56], and the other eight studies in China [50–55, 57, 60]. The study samples ranged from 2,354 to 333,183 people, with a total of 564,254 individuals. All cross-sectional studies were done in general adult populations with a mean age of 55.95 years old. All studies included both sexes with one study considered the most women percentage resulting in 65.4% [50]. Additionally, all studies were conducted in urban settings, except two [51, 57] that were performed in rural ones.
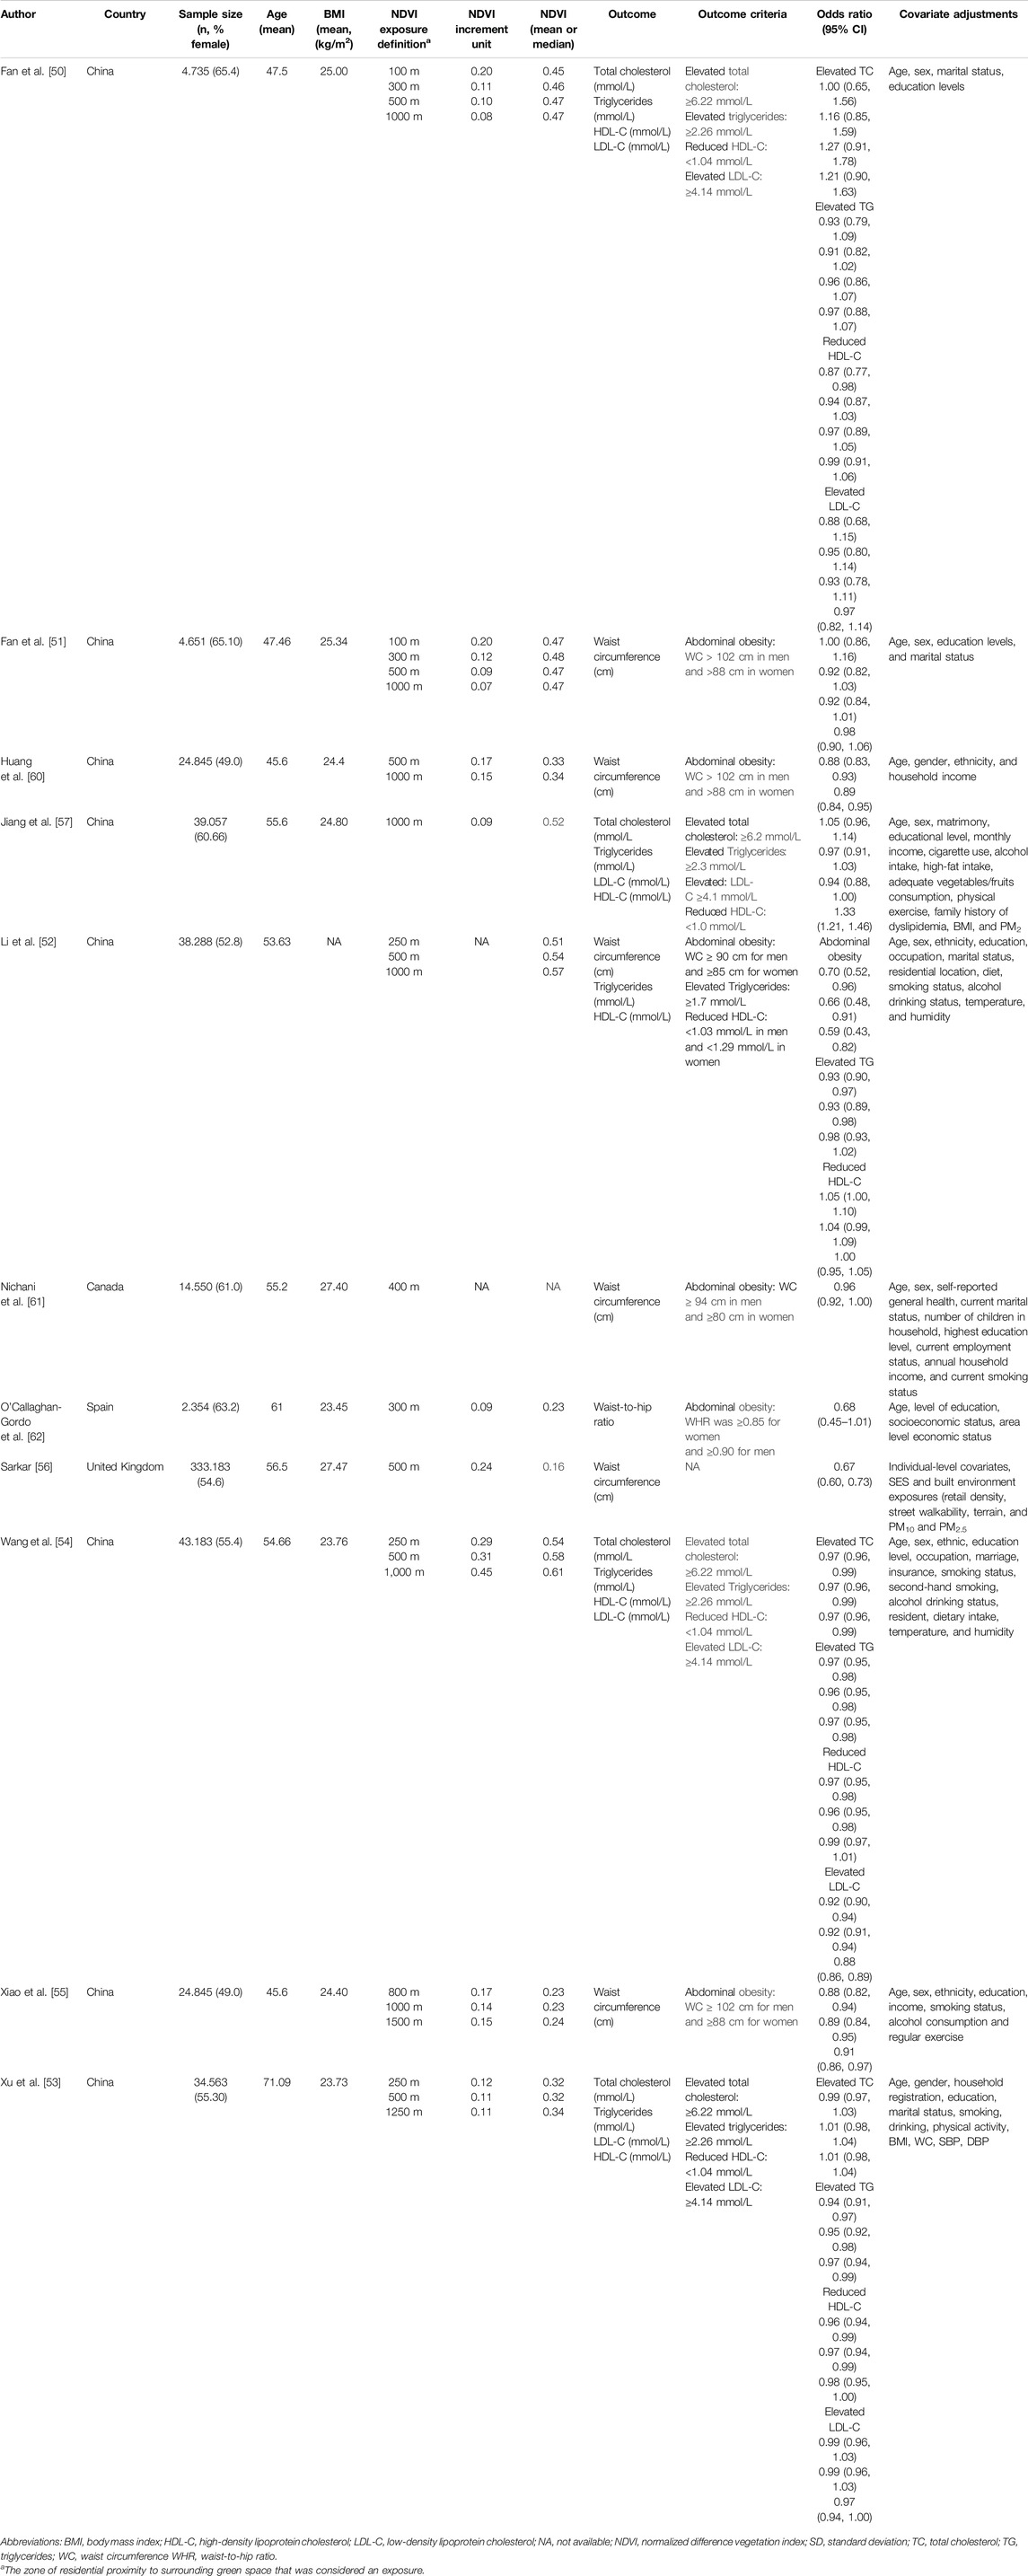
Table 1. Characteristics of the cross-sectional studies included in the systematic review and meta-analysis (worldwide, 2017–2023).
Quality Assessment
The methodological quality for studies examining waist circumference and residential greenness was classified as good in 18% and as fair in 82% of the included studies (Table 2). Concerning both exposure variables, it was possible to ascertain that the primary reason for a fair methodological quality was the follow-up items.
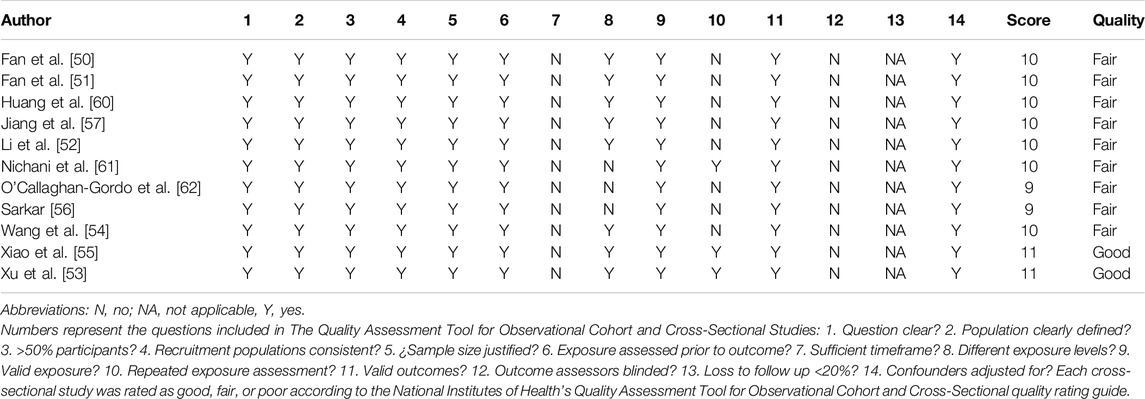
Table 2. Methodological quality assessment with the Observational Cohort and Cross-Sectional Studies Tool from the National Institute of Health National Heart, Lung, and Blood Institute [46] (worldwide, 2017–2023).
Association Between Residential Greenness and Abdominal Obesity
A significant inverse relationship was observed between an increase in surrounding greenness and reduced odds of abdominal obesity (OR: 0.80; 95% CI: 0.70–0.91; I2 = 85%) in a residential buffer zone of 1,500 m or less (Figure 2).
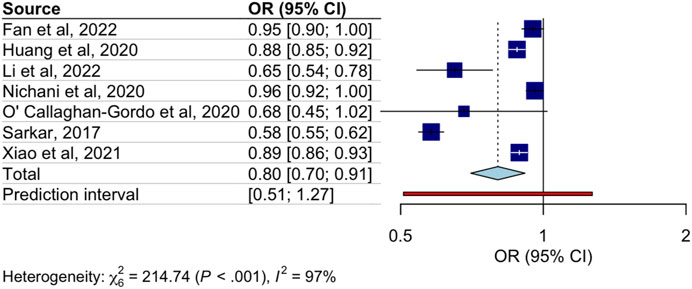
Figure 2. Association between increased Normalized Difference Vegetation Index values and the odds of abdominal obesity (worldwide, 2017–2022).
Subgroup analyses are displayed in Table 3. In the analysis conducted by sex [51, 55, 56, 60], the pooled ORs between higher NVDI values and the odds of abdominal obesity were significant only for females (OR: 0.82; 95% CI: 0.69–0.97; I2 = 95%) (Table 3). According to the socioeconomic status [55, 56, 60], the pooled ORs were significant for both individuals with lower (OR: 0.62; 95% CI: 0.41–0.93; I2 = 94%) and higher socioeconomic level (OR: 0.80; 95% CI: 0.66–0.97; I2 = 94%) (Table 3). Finally, according to the residential buffer zone subgroups (100 m [51, 52], 300 m [51, 62], 500 m [51, 52, 60], and 1,000 m [51, 55, 60]), the 500 m buffer zone (OR: 0.88; 95% CI: 0.81–0.96; I2 = 49%) and the 1000 m buffer zone (OR: 0.91; 95% CI: 0.86–0.97; I2 = 52%) showed a significant inverse relationship with the odds of abdominal obesity (Table 3).
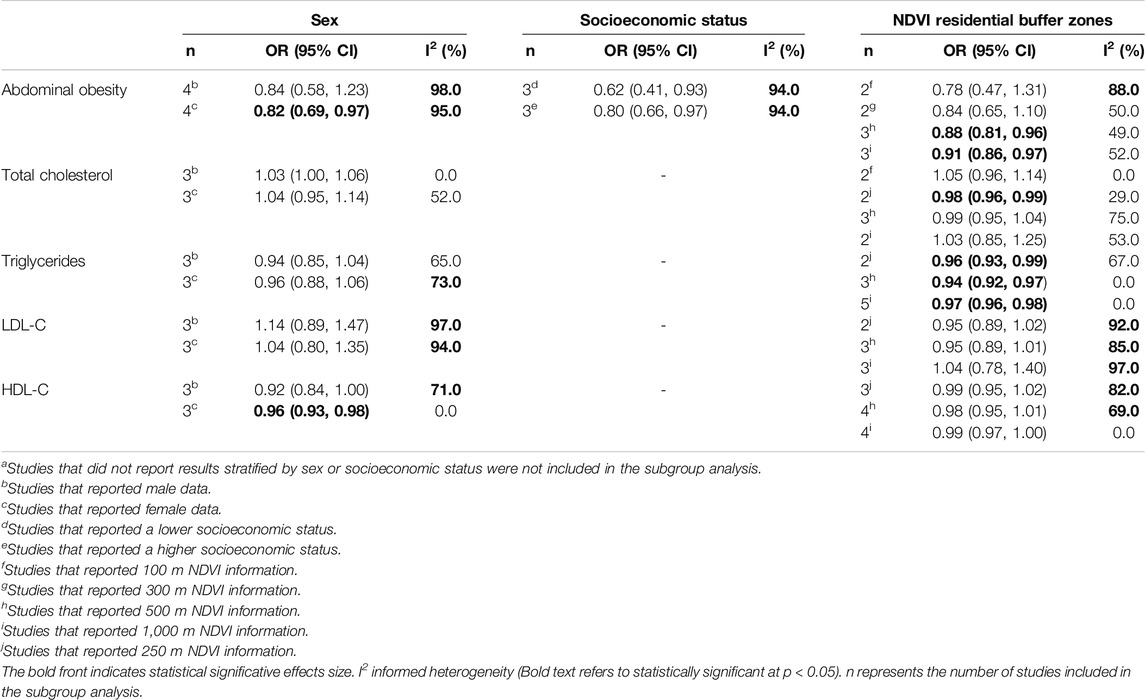
Table 3. Subgroup analyses of the associations between residential greenness with central obesity and dyslipidemia in adults of all agesa (worldwide, 2017–2023).
Association of Dyslipidemia With Residential Greenness
A significant inverse relationship was observed between an increase in surrounding greenness and diminished odds of elevated triglycerides (OR: 0.97; 95% CI: 0.96–0.97; I2 = 0%) and low HDL-C levels (OR: 0.98; 95% CI: 0.95–1.00; I2 = 76%) in a residential buffer zone of 1,250 m or less (Figure 3). Regarding other blood lipids, no significant associations were observed between higher NVDI values and the odds of high levels of total cholesterol (OR: 1.00; 95% CI: 0.97–1.03; I2 = 83%) and LDL-C (OR: 1.02; 95% CI: 0.93–1.12; I2 = 95%). In the analysis conducted by sex [50, 53, 57], the pooled OR in the female category showed a significant reduction in the odds of low HDL-C levels (OR: 0.96; 95% CI: 0.93–0.98; I2 = 0%) (Table 3). Finally, the pooled estimates for the residential buffer zone subgroups (100 m [50, 57], 250 m [52–54], 500 m [50, 52–54], and 1,000 m [50, 52, 54, 57]) were similar to the main pooled ORs (Table 3).
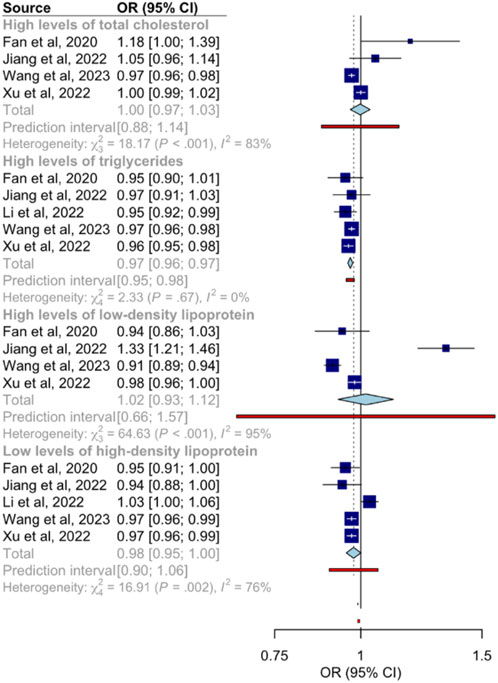
Figure 3. Associations between increased Normalized Difference Vegetation Index values and the odds of dyslipidemia (worldwide, 2020–2023).
Discussion
This novel systematic review and meta-analysis provides a synthesis of the available evidence assessing the associations of residential greenness with abdominal obesity and dyslipidemia in the general adult population. Our findings suggest an inverse association between higher NDVI values and the odds of abdominal obesity, with a significant association observed in women. In addition, our results show significant inverse associations of higher NDVI values with the odds of elevated triglycerides levels and the odds of low HDL-C. A significant association in women was also observed for HDL-C levels.
The waist circumference is an important health indicator of abdominal obesity, and its reduction through regular physical activity and a healthy diet has been demonstrated in numerous studies [63–66]. On the other hand, dyslipidemia has been also associated with certain healthy behaviors and lifestyles, also it includes regular physical activity and a healthy diet low in saturated fats. Access to greenness has been found to encourage physical activity by providing attractive places for practice exercise [12, 67–69]. Healthy cities also incorporate not only green spaces but also promote walkability, which in turn leads to increased physical activity among citizens [7, 70, 71]. Furthermore, some studies have found a correlation between exercise and healthier dietary habits [72, 73]. However, further research is required to ascertain the relationship between greenery and diet-related behaviors.
A noteworthy finding of our study is the significant association between surrounding residential greenness and reduced triglyceride levels. The lipoprotein lipase is a pivotal enzyme in lipid metabolism, and its primary function is to catalyze the hydrolysis of triglycerides [74, 75]. This lipoprotein also facilitates the transfer of lipids to HDL-C particles, promoting their maturation and increasing their levels, which enhances the reverse cholesterol transport process. This relationship between lipoprotein lipase, triglycerides and HDL is essential for maintaining a healthy lipid profile and reducing the risk of cardiovascular disease [76, 77]. Residential greenness could be associated with higher levels of physical activity and a considerable body of research has shown a positive correlation between exercising and an increase in the activity of lipoprotein lipase [78–80]. In addition, physical activity exerts an indirect influence on triglyceride levels by improving insulin sensitivity [81, 82].
Concerning the results of the subgroup analysis, it was found that women benefited more from greenery than men. This may be due to certain gender roles, as women tend to walk more than men as a form of physical exercise [83]. It can be observed that women tend to prefer activities that are less intense and more accessible than those chosen by men, who tend to select higher-intensity exercises such as weightlifting [84]. Furthermore, women frequently assume roles requiring more physical activity throughout the day, such as childcare and household management [85]. This can result in an increased level of incidental physical activity including walking.
Although data on socio-economic status were only available for waist circumference, this finding is particularly noteworthy. In this study, significant associations were observed between higher NDVI values and reduced waist circumference in both socio-economic groups. Specifically, living near green spaces was associated with a 38% lower probability of increased waist circumference for individuals with low socio-economic status, and a 20% lower probability for those with high socio-economic status. The lower odds of abdominal obesity among people with low socio-economic status can be attributed to several factors. Firstly, individuals with a higher socio-economic status are more likely to reside in proximity to green spaces. Furthermore, these spaces are often of superior quality and are more likely to be well-maintained and equipped [18, 86]. Secondly, individuals with this condition are not only more health-conscious and knowledgeable but also have more free time and more flexible working hours [87, 88]. Nevertheless, the association between residential greenness and socio-economic status observed in this study was more pronounced among individuals with diminished socio-economic standing. Green spaces offer such as free recreational and physical exercise opportunities for those with fewer resources [89, 90]. Nevertheless, this greater benefit in this group may be influenced by the fact that people with lower socioeconomic status tend to walk more frequently due to factors such as the lack of private transport and the necessity to move around the city cost-effectively [91, 92].
A further noteworthy finding of this meta-analysis concerns the associations between NDVI values of the smaller residential buffer sizes (250 m, 500 m, and 1,000 m) and the analyzed adiposity and blood lipid parameters. This may be attributed to the enhanced accessibility of nearby greenery, which may be further motivated to regular physical activities such as walking, jogging, and exercise than those located further away from the domicile [16].
The present systematic review and meta-analysis has some limitations that should be addressed. Firstly, the included studies employed a cross-sectional design, as this is the most prevalent type in the extant literature on the subject. This may be attributable to the reduced complexity and cost of such studies in comparison to their longitudinal counterparts. Nevertheless, this methodological limitation imposes constraints on our capacity to establish causal relationships, and the potential for confounding factors or biases cannot be discounted. Secondly, most of the analyses showed a considerable heterogeneity since specific between-study differences such as age groups and buffer sizes. Thirdly, only studies that analyzed NDVI continuously were included to avoid heterogeneity due to arbitrary categorization, which may result in the exclusion of other potential studies. Fourthly, the restricted geographical scope of the studies can be considered as a further limitation. It is evident that a considerable proportion of the included studies are from China, thereby reflecting a geographical bias in the extant literature. While the findings are relevant within that specific context, their generalizability to other regions, which may possess different socio-economic, cultural, political and health conditions, can vary significantly between countries, and it may affect the way studies are developed and interpreted. Studies conducted in multiple countries may offer a more complete and robust perspective. Moreover, the exclusion of studies published in languages other than English or Spanish may introduce language bias, potentially omitting valuable findings from regions where publications in other languages are more common. Finally, due to the limited number of studies (n < 10) analyzing the study associations, meta-regressions [36] and publication bias [93] could not be performed.
Conversely, this study has several strengths that warrant mention. To our knowledge, this is the first meta-analysis to examine the relationships of residential greenness with abdominal obesity and blood lipid levels, notably the inclusion of a wide range of publication dates achieved by the absence of temporal restrictions in the search criteria. Furthermore, restricting the independent variable to NDVI has ensured objectivity and accuracy to the results, as it provides a quantitative, objective, and comparable measure of the available vegetation. In addition, the subgroup analyses by sex and socio-economic status, as conducted in this study, enables a more comprehensive and detailed results. Finally, the incorporation of studies classified as fair quality may introduce methodological biases that could influence the interpretation of the overall results. However, the inclusion of studies with varying qualities ensures a more comprehensive evaluation to determine the potential limitations of the existing body of evidence regarding the relationships between residential greenness, abdominal obesity and blood lipid levels.
The findings of this systematic review and meta-analysis underscore the critical role of residential greenery and urban vegetation in promoting public health. Integrating green spaces into urban planning and public health policies is essential to maximize health benefits and foster inclusive, accessible environments. The proximity of residential areas to urban parks could enhance levels of moderate and vigorous physical activity, thereby contributing to the reduction of obesity [94, 95]. Similarly, dense urban tree planting has been associated with lower mortality risk and improved health and wellbeing [96, 97]. Moreover, initiatives such as green corridors have been showed to enhance active mobility, thereby providing metabolic and cardiovascular health advantages [98, 99]. To maximize these benefits, it is vital to promote multidisciplinary collaborations between urban planners, public health professionals, and policymakers [100]. The provision of safe, appealing environments because of such efforts not only encourages healthier behaviors, but also contributes to reducing the burden of chronic diseases and the associated costs to health systems.
Conclusion
The results of this study showed that increased residential greenness may be associated with reduced odds of both abdominal obesity and elevated triglycerides levels in the general adult population. This study provides a deeper understanding of how the green environment may be related to adiposity and blood lipid parameters in adults, as well as possible disparities according to specific sociodemographic characteristics. These findings could also contribute to reinforcing the importance of green spaces in public health, as this element, which is a fundamental component of healthy cities, could facilitate improved cardiovascular and metabolic health among the adult population by influencing their behavioral choices. Nevertheless, further longitudinal studies with greater geographical variability are required.
Data Availability Statement
The datasets generated or analyzed during the current study are not publicly available due to the research team’s decision. Still, they are available from the corresponding author on reasonable request.
Author Contributions
Concept and design of the manuscript: IM-T, BB-P, BN-P, and MM-A. Acquisition, analysis or interpretation of data: IM-T, BB-P, MM-A, and BN-P. Drafting of the manuscript: IM-T, BB-P, MM-A, and BN-P. Critical revision of the manuscript for important intellectual content: IM-T, BB-P, BN-P, SC; MF-P, AP-M, AD-F, and MM-A. All authors contributed to the article and approved the submitted version.
Funding
The author(s) declare that no financial support was received for the research, authorship, and/or publication of this article.
Conflict of Interest
The authors declare that they do not have any conflicts of interest.
Generative AI Statement
The author(s) declare that no Generative AI was used in the creation of this manuscript.
Supplementary Material
The Supplementary Material for this article can be found online at: https://www.ssph-journal.org/articles/10.3389/phrs.2025.1608163/full#supplementary-material
References
1. Krull, WPMB, Bauduceau, N, and Elmqvist, T. Towards an EU Research and Innovation Policy Agenda for Nature-Based Solutions and Re-Naturing Cities. In: Final Report of the Horizon 2020 Expert Group on Nature-Based Solutions and Re-Naturing Cities (2015). doi:10.2777/765301
2. Eggermont, H, Balian, E, Azevedo, M, Beumer, V, Brodin, T, Claudet, J, et al. Nature-Based Solutions: New Influence for Environmental Management and Research in Europe. Gaia Okologische Perspekt Nat Geistes- Wirtsch (2015) 24:243–8. doi:10.14512/gaia.24.4.9
3. World Health Organization & UN-Habitat. Global Report on Urban Health: Equitable Healthier Cities for Sustainable Development (2016). Available from: https://iris.who.int/handle/10665/204715 (Accessed July, 2024).
4. Wang, Q. Urbanization and Global Health: The Role of Air Pollution. Iran J Public Health (2018) 47(11):1644–52.
5. Kabisch, N, and Haase, D. Green Spaces of European Cities Revisited for 1990–2006. Landsc Urban Plan (2013) 110:113–22. doi:10.1016/j.landurbplan.2012.10.017
6. Salter, CM, Ahn, R, Yasin, F, Hines, R, Kornfield, L, Salter, EC, et al. Community Noise, Urbanization, and Global Health: Problems and Solutions. In: R Ahn, TF Burke, and AM McGahan, editors. Innovating for Healthy Urbanization. Boston, MA: Springer US (2015). p. 165–92. doi:10.1007/978-1-4899-7597-3_8
7. Sarkar, C, Webster, C, and Gallacher, J. Healthy Cities: Public Health Through Urban Planning. United Kingdom: Edward Elgar Publishing (2014). 424.
8. Barton, H, and Grant, M. Urban Planning for Healthy Cities. J Urban Health (2013) 90(1):129–41. doi:10.1007/s11524-011-9649-3
9. Pan American Health Organization, World Health Organization. Sustainable Development Goals (2024). Available from: https://www.paho.org/es/temas/objetivos-desarrollo-sostenible (Accessed May 23, 2024).
10. Nieuwenhuijsen, MJ. Urban and Transport Planning, Environmental Exposures and Health-New Concepts, Methods and Tools to Improve Health in Cities. Environ Health (2016) 15(1):S38. doi:10.1186/s12940-016-0108-1
11. Fong, KC, Hart, JE, and James, P. A Review of Epidemiologic Studies on Greenness and Health: Updated Literature Through 2017. Curr Environ Health Rep (2018) 5(1):77–87. doi:10.1007/s40572-018-0179-y
12. Yang, BY, Zhao, T, Hu, LX, Browning, MHEM, Heinrich, J, Dharmage, SC, et al. Greenspace and Human Health: An Umbrella Review. The Innovation (202) 2(4):100164. doi:10.1016/j.xinn.2021.100164
13. Keith, RJ, Hart, JL, and Bhatnagar, A. Greenspaces and Cardiovascular Health. Circ Res (2024) 134(9):1179–96. doi:10.1161/CIRCRESAHA.124.323583
14. Fernández Núñez, MB, Campos Suzman, L, Maneja, R, Bach, A, Marquet, O, Anguelovski, I, et al. Gender and Sex Differences in Urban Greenness’ Mental Health Benefits: A Systematic Review. Health Place (2022) 76:102864. doi:10.1016/j.healthplace.2022.102864
15. Fernández Núñez, MB, Campos Suzman, L, Maneja, R, Bach, A, Marquet, O, Anguelovski, I, et al. The Differences by Sex and Gender in the Relationship Between Urban Greenness and Cardiometabolic Health: A Systematic Review. J Urban Health Bull N Y Acad Med (2022) 99(6):1054–67. doi:10.1007/s11524-022-00685-9
16. Cardinali, M, Beenackers, MA, van Timmeren, A, and Pottgiesser, U. The Relation Between Proximity to and Characteristics of Green Spaces to Physical Activity and Health: A Multi-Dimensional Sensitivity Analysis in Four European Cities. Environ Res (2024) 241:117605. doi:10.1016/j.envres.2023.117605
17. Hoffimann, E, Barros, H, and Ribeiro, AI. Socioeconomic Inequalities in Green Space Quality and Accessibility—Evidence From a Southern European City. Int J Environ Res Public Health (2017) 14(8):916. doi:10.3390/ijerph14080916
18. Cole, HVS, Lamarca, MG, Connolly, JJT, and Anguelovski, I. Are Green Cities Healthy and Equitable? Unpacking the Relationship between Health, Green Space and Gentrification. J Epidemiol Community Health (2017) 71(11):1118–21. doi:10.1136/jech-2017-209201
19. Sugiyama, T, Villanueva, K, Knuiman, M, Francis, J, Foster, S, Wood, L, et al. Can Neighborhood Green Space Mitigate Health Inequalities? A Study of Socio-Economic Status and Mental Health. Health Place (2016) 38:16–21. doi:10.1016/j.healthplace.2016.01.002
20. World Heart Federation. Cardiovascular Disease (CVD). Available from: https://world-heart-federation.org/what-is-cvd/ (Accessed May 24, 2024).
21. Yusuf, S, Joseph, P, Rangarajan, S, Islam, S, Mente, A, Hystad, P, et al. Modifiable Risk Factors, Cardiovascular Disease, and Mortality in 155 722 Individuals From 21 High-Income, Middle-Income, and Low-Income Countries (PURE): A Prospective Cohort Study. The Lancet (2020) 395(10226):795–808. doi:10.1016/S0140-6736(19)32008-2
22. Francula-Zaninovic, S, and Nola, IA. Management of Measurable Variable Cardiovascular Disease’ Risk Factors. Curr Cardiol Rev (2018) 14(3):153–63. doi:10.2174/1573403X14666180222102312
23. Juonala, M, Magnussen, CG, Berenson, GS, Venn, A, Burns, TL, Sabin, MA, et al. Childhood Adiposity, Adult Adiposity, and Cardiovascular Risk Factors. New Engl J Med (2024) 365:1876–85. doi:10.1056/NEJMoa1010112
24. Menke, A, Muntner, P, Wildman, RP, Reynolds, K, and He, J. Measures of Adiposity and Cardiovascular Disease Risk Factors. Obesity (2007) 15(3):785–95. doi:10.1038/oby.2007.593
25. Xie, Y, Guo, L, Chen, H, Xu, J, Qu, P, Zhu, L, et al. Determination of the Postprandial Cut-Off Value of Triglyceride After a Daily Meal Corresponding to Fasting Optimal Triglyceride Level in Chinese Subjects. Front Nutr (2023) 10:1037270. doi:10.3389/fnut.2023.1037270
26. Wakabayashi, I, and Daimon, T. Comparison of Discrimination for Cardio-Metabolic Risk by Different Cut-Off Values of the Ratio of Triglycerides to HDL Cholesterol. Lipids Health Dis (2019) 18(1):156. doi:10.1186/s12944-019-1098-0
27. Hu, H, Kurotani, K, Sasaki, N, Murakami, T, Shimizu, C, Shimizu, M, et al. Optimal Waist Circumference Cut-Off Points and Ability of Different Metabolic Syndrome Criteria for Predicting Diabetes in Japanese Men and Women: Japan Epidemiology Collaboration on Occupational Health Study. BMC Public Health (2016) 16:220. doi:10.1186/s12889-016-2856-9
28. Wang, Z, Ma, J, and Si, D. Optimal Cut-Off Values and Population Means of Waist Circumference in Different Populations. Nutr Res Rev (2010) 23(2):191–9. doi:10.1017/S0954422410000120
29. Pettorelli, N, Vik, JO, Mysterud, A, Gaillard, JM, Tucker, CJ, and Stenseth, NC. Using the Satellite-Derived NDVI to Assess Ecological Responses to Environmental Change. Trends Ecol Evol (2005) 20(9):503–10. doi:10.1016/j.tree.2005.05.011
30. Vilcins, D, Sly, PD, Scarth, P, and Mavoa, S. Green Space in Health Research: An Overview of Common Indicators of Greenness. Rev Environ Health (2024) 39(2):221–31. doi:10.1515/reveh-2022-0083
31. Hart, JL, Yeager, RA, Riggs, DW, Fleischer, D, Owolabi, U, Walker, KL, et al. The Relationship between Perceptions and Objective Measures of Greenness. Int J Environ Res Public Health (2022) 19(23):16317. doi:10.3390/ijerph192316317
32. Lachowycz, K, and Jones, AP. Greenspace and Obesity: A Systematic Review of the Evidence. Obes Rev Off J Int Assoc Study Obes (2011) 12(5):e183–9. doi:10.1111/j.1467-789X.2010.00827.x
33. Li, M, Chi, X, Wang, Y, Setrerrahmane, S, Xie, W, and Xu, H. Trends in Insulin Resistance: Insights into Mechanisms and Therapeutic Strategy. Signal Transduct Target Ther (2022) 7(1):216. doi:10.1038/s41392-022-01073-0
34. Lechner, K, McKenzie, AL, Kränkel, N, Von Schacky, C, Worm, N, Nixdorff, U, et al. High-Risk Atherosclerosis and Metabolic Phenotype: The Roles of Ectopic Adiposity, Atherogenic Dyslipidemia, and Inflammation. Metab Syndr Relat Disord (2020) 18(4):176–85. doi:10.1089/met.2019.0115
35. Stroup, DF, Berlin, JA, Morton, SC, Olkin, I, Williamson, GD, Rennie, D, et al. Meta-Analysis of Observational Studies in Epidemiology: A Proposal for Reporting. Meta-Analysis of Observational Studies in Epidemiology (MOOSE) Group. JAMA (2000) 283(15):2008–12. doi:10.1001/jama.283.15.2008
36. Higgins, J, and Green, S. Cochrane Handbook for Systematic Reviews of Interventions (2024). Available from: https://training.cochrane.org/handbook (Accessed June 6, 2024).
37. Morgan, RL, Whaley, P, Thayer, KA, and Schünemann, HJ. Identifying the PECO: A Framework for Formulating Good Questions to Explore the Association of Environmental and Other Exposures With Health Outcomes. Environ Int (2018) 121(Pt 1):1027–31. doi:10.1016/j.envint.2018.07.015
38. Ahmed, KKM, and Al Dhubaib, BE. Zotero: A Bibliographic Assistant to Researcher. J Pharmacol Pharmacother (2011) 2(4):303–5. doi:10.4103/0976-500X.85940
39. Huang, S, Tang, L, Hupy, JP, Wang, Y, and Shao, G. A Commentary Review on the Use of Normalized Difference Vegetation Index (NDVI) in the Era of Popular Remote Sensing. J For Res (2021) 32(1):1–6. doi:10.1007/s11676-020-01155-1
40. Rhew, IC, Vander Stoep, A, Kearney, A, Smith, NL, and Dunbar, MD. Validation of the Normalized Difference Vegetation Index as a Measure of Neighborhood Greenness. Ann Epidemiol (2011) 21(12):946–52. doi:10.1016/j.annepidem.2011.09.001
41. Kee, CC, Jamaiyah, H, Geeta, A, Ali, ZA, Safiza, MNN, Suzana, S, et al. Sensitivity and Specificity of Waist Circumference as a Single Screening Tool for Identification of Overweight and Obesity Among Malaysian Adults. Med J Malaysia (2011) 66(5):462–7.
42. World Health Organization. Waist Circumference and Waist-Hip Ratio: Report of a WHO Expert Consultation (2024). Available from: https://www.who.int/publications-detail-redirect/9789241501491 (Accessed June 10, 2024).
43. Gofman, JW, Jones, HB, Lindgren, FT, Lyon, TP, Elliot, HA, and Strisower, B. Blood Lipids and Human Atherosclerosis. Circulation (1950) 2(2):161–78. doi:10.1161/01.cir.2.2.161
44. National Health, Lung, and Blood Institute. Blood Cholesterol - Diagnosis (2024). Available from: https://www.nhlbi.nih.gov/health/blood-cholesterol/diagnosis (Accessed June 10, 2024).
45. Anonymous, 2016 Chinese Guidelines for the Management of Dyslipidemia in Adults. J Geriatr Cardiol JGC (2018) 15(1):1–29. doi:10.11909/j.issn.1671-5411.2018.01.011
46. National Heart, Lung, and Blood Institute. Study Qual Assess Tools (2024). Available from: https://www.nhlbi.nih.gov/health-topics/study-quality-assessment-tools (Accessed June 7, 2024).
47. DerSimonian, R, and Kacker, R. Random-Effects Model for Meta-Analysis of Clinical Trials: An Update. Contemp Clin Trials (2007) 28(2):105–14. doi:10.1016/j.cct.2006.04.004
48. IntHout, J, Ioannidis, JPA, Rovers, MM, and Goeman, JJ. Plea for Routinely Presenting Prediction Intervals in Meta-Analysis. BMJ Open (2016) 6(7):e010247. doi:10.1136/bmjopen-2015-010247
49. Higgins, JPT, and Thompson, SG. Quantifying Heterogeneity in a Meta-Analysis. Stat Med (2002) 21(11):1539–58. doi:10.1002/sim.1186
50. Fan, S, Yang, BY, Xue, Z, Huang, WZ, Zhou, Z, Yuan, J, et al. Associations Between Residential Greenness and Blood Lipids in Chinese Uyghur Adults. Environ Int (2020) 142:105903. doi:10.1016/j.envint.2020.105903
51. Fan, S, Feng, W, Zhou, Z, Guo, Y, Xue, Z, Yuan, J, et al. Association Between Residential Greenness and Overweight/Obesity Among Rural Adults in Northwestern China. Environ Res (2022) 204:112358. doi:10.1016/j.envres.2021.112358
52. Li, X, Wang, Q, Feng, C, Yu, B, Lin, X, Fu, Y, et al. Associations and Pathways Between Residential Greenness and Metabolic Syndromes in Fujian Province. Front Public Health (2022) 10:1014380. doi:10.3389/fpubh.2022.1014380
53. Xu, J, Yuan, X, Ni, W, Sun, Y, Zhang, H, Zhang, Y, et al. Associations Between Residential Greenness and Blood Lipids in Chinese Elderly Population. J Endocrinol Invest (2022) 45(12):2329–39. doi:10.1007/s40618-022-01870-y
54. Wang, Q, Li, X, Zhong, W, Liu, H, Feng, C, Song, C, et al. Residential Greenness and Dyslipidemia Risk: Dose-Response Relations and Mediation Through BMI and Air Pollution. Environ Res (2023) 217:114810. doi:10.1016/j.envres.2022.114810
55. Xiao, X, Wang, R, Knibbs, LD, Jalaludin, B, Heinrich, J, Markevych, I, et al. Street View Greenness Is Associated With Lower Risk of Obesity in Adults: Findings From the 33 Chinese Community Health Study. Environ Res (2021) 200:111434. doi:10.1016/j.envres.2021.111434
56. Sarkar, C. Residential Greenness and Adiposity: Findings From the UK Biobank. Environ Int (2017) 106:1–10. doi:10.1016/j.envint.2017.05.016
57. Jiang, J, Mao, S, Xie, Y, Chen, X, Abulaiti, K, Liu, M, et al. Is Residential Greenness Associated With Dyslipidemia and Lipid Levels in Chinese Rural-Dwelling Adults? The Henan Rural Cohort Study. Environ Sci Pollut Res Int (2022) 29(4):5852–62. doi:10.1007/s11356-021-16026-3
58. Rohatgi, A. WebPlotDigitizer (2022). Available from: https://automeris.io/WebPlotDigitizer (Accessed May, 2024).
59. Team, R. Core. RA Language and Environment for Statistical Computing. Vienna, Austria: R Foundation for Statistical (2020).
60. Huang, WZ, Yang, BY, Yu, HY, Bloom, MS, Markevych, I, Heinrich, J, et al. Association Between Community Greenness and Obesity in Urban-Dwelling Chinese Adults. Sci Total Environ (2020) 702:135040. doi:10.1016/j.scitotenv.2019.135040
61. Nichani, V, Turley, L, Vena, JE, and McCormack, GR. Associations Between the Neighbourhood Characteristics and Body Mass Index, Waist Circumference, and Waist-To-Hip Ratio: Findings from Alberta’s Tomorrow Project. Health Place (2020) 64:102357. doi:10.1016/j.healthplace.2020.102357
62. O’Callaghan-Gordo, C, Espinosa, A, Valentin, A, Tonne, C, Pérez-Gómez, B, Castaño-Vinyals, G, et al. Green Spaces, Excess Weight and Obesity in Spain. Int J Hyg Environ Health (2020) 223(1):45–55. doi:10.1016/j.ijheh.2019.10.007
63. Du, H, Bennett, D, Li, L, Whitlock, G, Guo, Y, Collins, R, et al. Physical Activity and Sedentary Leisure Time and Their Associations With BMI, Waist Circumference, and Percentage Body Fat in 0.5 Million Adults: The China Kadoorie Biobank Study. Am J Clin Nutr (2013) 97(3):487–96. doi:10.3945/ajcn.112.046854
64. Schröder, H, Mendez, MA, Ribas-Barba, L, Covas, MI, and Serra-Majem, L. Mediterranean Diet and Waist Circumference in a Representative National Sample of Young Spaniards. Int J Pediatr Obes (2010) 5(6):516–9. doi:10.3109/17477161003777417
65. Cárdenas Fuentes, G, Bawaked, RA, Martínez González, MÁ, Corella, D, Subirana Cachinero, I, Salas-Salvadó, J, et al. Association of Physical Activity With Body Mass Index, Waist Circumference and Incidence of Obesity in Older Adults. Eur J Public Health (2018) 28(5):944–50. doi:10.1093/eurpub/cky030
66. Sares-Jäske, L, Knekt, P, Männistö, S, Lindfors, O, and Heliövaara, M. Self-Report Dieting and Long-Term Changes in Body Mass Index and Waist Circumference. Obes Sci Pract (2019) 5(4):291–303. doi:10.1002/osp4.336
67. Müller, C, Paulsen, L, Bucksch, J, and Wallmann-Sperlich, B. Built and Natural Environment Correlates of Physical Activity of Adults Living in Rural Areas: A Systematic Review. Int J Behav Nutr Phys Act (2024) 21(1):52. doi:10.1186/s12966-024-01598-3
68. Christie, CD, Consoli, A, Ronksley, PE, Vena, JE, Friedenreich, CM, and McCormack, GR. Associations Between the Built Environment and Physical Activity Among Adults with Low Socio-Economic Status in Canada: A Systematic Review. Can J Public Health (2021) 112(1):152–65. doi:10.17269/s41997-020-00364-9
69. Markevych, I, Schoierer, J, Hartig, T, Chudnovsky, A, Hystad, P, Dzhambov, AM, et al. Exploring Pathways Linking Greenspace to Health: Theoretical and Methodological Guidance. Environ Res (2017) 158:301–17. doi:10.1016/j.envres.2017.06.028
70. Marquet, O, Hirsch, JA, Kerr, J, Jankowska, MM, Mitchell, J, Hart, JE, et al. GPS-Based Activity Space Exposure to Greenness and Walkability Is Associated With Increased Accelerometer-Based Physical Activity. Environ Int (2022) 165:107317. doi:10.1016/j.envint.2022.107317
71. Juul, V, and Nordbø, ECA. Examining Activity-Friendly Neighborhoods in the Norwegian Context: Green Space and Walkability in Relation to Physical Activity and the Moderating Role of Perceived Safety. BMC Public Health (2023) 23(1):259. doi:10.1186/s12889-023-15170-4
72. Cobb-Clark, DA, Kassenboehmer, SC, and Schurer, S. Healthy Habits: The Connection Between Diet, Exercise, and Locus of Control. J Econ Behav Organ (2014) 98:1–28. doi:10.1016/j.jebo.2013.10.011
73. Eaton, CB, McPhillips, JB, Gans, KM, Garber, CE, Assaf, AR, Lasater, TM, et al. Cross-Sectional Relationship Between Diet and Physical Activity in Two Southeastern New England Communities. Am J Prev Med (1995) 11(4):238–44. doi:10.1016/s0749-3797(18)30452-5
74. Kobayashi, J, and Mabuchi, H. Lipoprotein Lipase and Atherosclerosis. Ann Clin Biochem (2015) 52(6):632–7. doi:10.1177/0004563215590451
75. Davis, RC, Wong, H, Nikazy, J, Wang, K, Han, Q, and Schotz, MC. Chimeras of Hepatic Lipase and Lipoprotein Lipase. Domain Localization of Enzyme-Specific Properties. J Biol Chem (1992) 267(30):21499–504. doi:10.1016/s0021-9258(19)36637-2
76. Wang, H, and Eckel, RH. Lipoprotein Lipase: From Gene to Obesity. Am J Physiol Endocrinol Metab (2009) 297(2):E271–88. doi:10.1152/ajpendo.90920.2008
77. Wu, SA, Kersten, S, and Qi, L. Lipoprotein Lipase and its Regulators: An Unfolding Story. Trends Endocrinol Metab TEM (2021) 32(1):48–61. doi:10.1016/j.tem.2020.11.005
78. Nikkilä, EA, Taskinen, MR, Rehunen, S, and Härkönen, M. Lipoprotein Lipase Activity in Adipose Tissue and Skeletal Muscle of Runners: Relation to Serum Lipoproteins. Metabolism (1978) 27(11):1661–7. doi:10.1016/0026-0495(78)90288-3
79. Kantor, MA, Cullinane, EM, Herbert, PN, and Thompson, PD. Acute Increase in Lipoprotein Lipase Following Prolonged Exercise. Metabolism (1984) 33(5):454–7. doi:10.1016/0026-0495(84)90147-1
80. Boer, JM, Kuivenhoven, JA, Feskens, EJ, Schouten, EG, Havekes, LM, Seidell, JC, et al. Physical Activity Modulates the Effect of a Lipoprotein Lipase Mutation (D9N) on Plasma Lipids and Lipoproteins. Clin Genet (1999) 56(2):158–63. doi:10.1034/j.1399-0004.1999.560212.x
81. Bird, SR, and Hawley, JA. Update on the Effects of Physical Activity on Insulin Sensitivity in Humans. BMJ Open Sport Exerc Med (2017) 2(1):e000143. doi:10.1136/bmjsem-2016-000143
82. Hamasaki, H, Noda, M, Moriyama, S, Yoshikawa, R, Katsuyama, H, Sako, A, et al. Daily Physical Activity Assessed by a Triaxial Accelerometer Is Beneficially Associated With Waist Circumference, Serum Triglycerides, and Insulin Resistance in Japanese Patients With Prediabetes or Untreated Early Type 2 Diabetes. J Diabetes Res (2015) 2015(1):526201. doi:10.1155/2015/526201
83. Kavanagh, AM, and Bentley, R. Walking: A Gender Issue? Aust J Soc Issues (2008) 43(1):45–64. doi:10.1002/j.1839-4655.2008.tb00089.x
84. Pollard, TM, and Wagnild, JM. Gender Differences in Walking (For Leisure, Transport and in Total) Across Adult Life: A Systematic Review. BMC Public Health (2017) 17(1):341. doi:10.1186/s12889-017-4253-4
85. Hamilton, K, and White, KM. Understanding Parental Physical Activity: Meanings, Habits, and Social Role Influence. Psychol Sport Exerc (2010) 11(4):275–85. doi:10.1016/j.psychsport.2010.02.006
86. Cole, HVS, Triguero-Mas, M, Connolly, JJT, and Anguelovski, I. Determining the Health Benefits of Green Space: Does Gentrification Matter? Health Place (2019) 57:1–11. doi:10.1016/j.healthplace.2019.02.001
87. Cerin, E, and Leslie, E. How Socio-Economic Status Contributes to Participation in Leisure-Time Physical Activity. Soc Sci Med (2008) 66(12):2596–609. doi:10.1016/j.socscimed.2008.02.012
88. Ray, TK, and Pana-Cryan, R. Work Flexibility and Work-Related Well-Being. Int J Environ Res Public Health (2021) 18(6):3254. doi:10.3390/ijerph18063254
89. Lin, BB, and Andersson, E. A Transdisciplinary Framework to Unlock the Potential Benefits of Green Spaces for Urban Communities under Changing Contexts. BioScience (2023) 73(3):196–205. doi:10.1093/biosci/biad009
90. Astell-Burt, T, Feng, X, Mavoa, S, Badland, HM, and Giles-Corti, B. Do Low-Income Neighbourhoods Have the Least Green Space? A Cross-Sectional Study of Australia’s Most Populous Cities. BMC Public Health (2014) 14(1):292. doi:10.1186/1471-2458-14-292
91. Yang, Y, Diez Roux, AV, Auchincloss, AH, Rodriguez, DA, and Brown, DG. Exploring Walking Differences by Socioeconomic Status Using a Spatial Agent-Based Model. Health Place (2012) 18(1):96–9. doi:10.1016/j.healthplace.2011.08.010
92. Caspi, CE, Kawachi, I, Subramanian, S, Tucker-Seeley, R, and Sorensen, G. The Social Environment and Walking Behavior Among Low-Income Housing Residents. Soc Sci Med (1982) 80:76–84. doi:10.1016/j.socscimed.2012.11.030
93. Sterne, JAC, Sutton, AJ, Ioannidis, JPA, Terrin, N, Jones, DR, Lau, J, et al. Recommendations for Examining and Interpreting Funnel Plot Asymmetry in Meta-Analyses of Randomised Controlled Trials. BMJ (2011) 343:d4002. doi:10.1136/bmj.d4002
94. Kaczynski, AT, Besenyi, GM, Stanis, SAW, Koohsari, MJ, Oestman, KB, Bergstrom, R, et al. Are Park Proximity and Park Features Related to Park Use and Park-Based Physical Activity Among Adults? Variations by Multiple Socio-Demographic Characteristics. Int J Behav Nutr Phys Act (2014) 11(1):146. doi:10.1186/s12966-014-0146-4
95. Lee, KH, Heo, J, Jayaraman, R, and Dawson, S. Proximity to Parks and Natural Areas as an Environmental Determinant to Spatial Disparities in Obesity Prevalence. Appl Geogr (2019) 112:102074. doi:10.1016/j.apgeog.2019.102074
96. Crouse, DL, Pinault, L, Balram, A, Hystad, P, Peters, PA, Chen, H, et al. Urban Greenness and Mortality in Canada’s Largest Cities: A National Cohort Study. Lancet Planet Health (2017) 1(7):e289–97. doi:10.1016/S2542-5196(17)30118-3
97. Pataki, DE, Alberti, M, Cadenasso, ML, Felson, AJ, McDonnell, MJ, Pincetl, S, et al. The Benefits and Limits of Urban Tree Planting for Environmental and Human Health. Front Ecol Evol (2021) 9:603757. doi:10.3389/fevo.2021.603757
98. Mancilla, D, Robledo, S, Esenarro, D, Raymundo, V, and Vega, V. Green Corridors and Social Connectivity With a Sustainable Approach in the City of Cuzco in Peru. Urban Sci (2024) 8(3):79. doi:10.3390/urbansci8030079
99. Coutts, C. Greenway Accessibility and Physical-Activity Behavior. Environ Plan B Plan Des (2008) 35(3):552–63. doi:10.1068/b3406
Keywords: green spaces, residential greenness, cholesterol, dyslipidemia, meta-analysis
Citation: Marcilla-Toribio I, Bizzozero-Peroni B, Notario-Pacheco B, Cekrezi S, Fernandez-Perez M, Perez-Moreno A, Diez-Fernandez A and Martinez-Andres M (2025) Surrounding Residential Greenness and Health: Associations With Abdominal Obesity and Dyslipidemia. A Meta-Analysis of Cross-Sectional Studies. Public Health Rev 46:1608163. doi: 10.3389/phrs.2025.1608163
Received: 15 November 2024; Accepted: 03 February 2025;
Published: 18 February 2025.
Edited by:
Ana Ribeiro, University Porto, PortugalReviewed by:
Luciene Almeida, Oswaldo Cruz Foundation (Fiocruz), BrazilDesmond Gagakuma, RMIT University, Australia
Copyright © 2025 Marcilla-Toribio, Bizzozero-Peroni, Notario-Pacheco, Cekrezi, Fernandez-Perez, Perez-Moreno, Diez-Fernandez and Martinez-Andres. This is an open-access article distributed under the terms of the Creative Commons Attribution License (CC BY). The use, distribution or reproduction in other forums is permitted, provided the original author(s) and the copyright owner(s) are credited and that the original publication in this journal is cited, in accordance with accepted academic practice. No use, distribution or reproduction is permitted which does not comply with these terms.
PHR is edited by the Swiss School of Public Health (SSPH+) in a partnership with the Association of Schools of Public Health of the European Region (ASPHER)+
*Correspondence: Bruno Bizzozero-Peroni, YnJ1bm8uYml6em96ZXJvQHVjbG0uZXM=
†ORCID: Irene Marcilla-Toribio, orcid.org/0000-0003-3378-0501; Bruno Bizzozero-Peroni, orcid.org/0000-0003-0614-5561; Blanca Notario-Pacheco, orcid.org/0000-0001-8406-6952; Shkelzen Cekrezi, orcid.org/0009-0003-5016-3529; Martin Fernandez-Perez, orcid.org/0000-0001-6182-6955; Ana Perez-Moreno, orcid.org/0009-0006-3594-7183; Ana Diez-Fernandez, orcid.org/0000-0002-7673-986X; Maria Martinez-Andres, orcid.org/0000-0001-5312-7361