 Heresh Amini1,2*†
 Fatemeh Yousefian3†
 Sasan Faridi4†
 Zorana J. Andersen5Ellénore Calas6
 Alberto Castro7,8Karla Cervantes-Martínez9Thomas Cole-Hunter5
 Magali Corso10
 Natasa Dragic11Dimitris Evangelopoulos12Christian Gapp13Mohammad Sadegh Hassanvand4
 Ingu Kim14Alain Le Tertre15Sylvia Medina10Brian Miller16Stephanie Montero17Weeberb J. Requia18Horacio Riojas-Rodriguez19
 David Rojas-Rueda20,21Evangelia Samoli22Jose Luis Texcalac-Sangrador19
 Maayan Yitshak-Sade1,2Joel Schwartz23
 Nino Kuenzli7,8Joseph V. Spadaro24
 Michal Krzyzanowski25
 Pierpaolo Mudu14
- 1Department of Environmental Medicine and Climate Science, Icahn School of Medicine at Mount Sinai, New York, NY, United States
- 2Institute for Climate Change, Environmental Health, and Exposomics, Icahn School of Medicine at Mount Sinai, New York, NY, United States
- 3Department of Environmental Health Engineering, Faculty of Health, Kashan University of Medical Sciences, Kashan, Iran
- 4Center for Air Pollution Research (CAPR), Institute for Environmental Research (IER), Tehran University of Medical Sciences, Tehran, Iran
- 5Department of Public Health, University of Copenhagen, Copenhagen, Denmark
- 6University of Paris-Saclay, Saint Aubin, France
- 7Swiss Tropical and Public Health Institute, Allschwil, Switzerland
- 8University of Basel, Basel, Switzerland
- 9Department of Environment, Climate Change and Health, World Health Organization, Geneva, Switzerland
- 10Department of Environmental and Occupational Health, Santé Publique France, Saint-Maurice, France
- 11Faculty of Medicine, University of Novi Sad, Novi Sad, Serbia
- 12Environmental Research Group, MRC Centre for Environment and Health, Imperial College London, London, United Kingdom
- 13World Health Organization Regional Office for Europe, Copenhagen, Denmark
- 14European Centre for Environment and Health, World Health Organization, Regional Office for Europe, Bonn, Germany
- 15Regional Office Bretagne, Santé Publique France, Rennes, France
- 16Institute of Occupational Medicine (IOM), Edinburgh, United Kingdom
- 17Clean Air Institute, Washington, DC, United States
- 18Center for Environment and Public Health Studies, School of Public Policy and Government, Fundação Getúlio Vargas, Brasília, Brazil
- 19Department of Environmental Health, National Institute of Public Health, Cuernavaca, Mexico
- 20Department of Environmental and Radiological Health Sciences, Colorado State University, Fort Collins, CO, United States
- 21Colorado School of Public Health, Colorado State University, Fort Collins, CO, United States
- 22Department of Hygiene, Epidemiology and Medical Statistics, Medical School, National and Kapodistrian University of Athens, Athens, Greece
- 23Department of Environmental Health, Harvard T.H. Chan School of Public Health, Boston, MA, United States
- 24Spadaro Environmental Research Consultants (SERC), Philadelphia, PA, United States
- 25School of Public Health, Imperial College London, London, United Kingdom
Objectives: We evaluated studies that used the World Health Organization’s (WHO) AirQ and AirQ+ tools for air pollution (AP) health risk assessment (HRA) and provided best practice suggestions for future assessments.
Methods: We performed a comprehensive review of studies using WHO’s AirQ and AirQ+ tools, searching several databases for relevant articles, reports, and theses from inception to Dec 31, 2022.
Results: We identified 286 studies that met our criteria. The studies were conducted in 69 countries, with most (57%) in Iran, followed by Italy and India (∼8% each). We found that many studies inadequately report air pollution exposure data, its quality, and validity. The decisions concerning the analysed population size, health outcomes of interest, baseline incidence, concentration-response functions, relative risk values, and counterfactual values are often not justified, sufficiently. Many studies lack an uncertainty assessment.
Conclusion: Our review found a number of common shortcomings in the published assessments. We suggest better practices and urge future studies to focus on the quality of input data, its reporting, and associated uncertainties.
Introduction
Air pollution (AP) is a significant health risk, leading to a range of diseases and premature deaths [1, 2]. In 2019, AP, particularly from fine particulate matter (PM2.5) and household solid fuels, was linked to approximately 6.45 million early deaths globally, with ambient air pollution (AAP) accounting for about 4.1 million [2]. Health risk assessment (HRA) studies have reported similar or higher figures [3, 4]. These estimates vary based on factors like study design, population, AAP exposure, choice of concentration-response function [CRF; also called exposure-response functions (ERF)], study period, health outcomes, and counterfactual values. However, they all follow a common HRA concept [5].
Concerns about AP have led to the development of methods to assess its health impacts and predict changes due to varying AP levels. This data aids in policy-making to mitigate AP. Scientists agree on these methods, which are implemented via spreadsheets and integrated into user-friendly tools. These tools, used by scientists, policy analysts, NGOs, and the public, facilitate the HRA of AP [6]. The WHO reported on several HRA tools in 2016, but few had a long maintenance history. Notable exceptions are WHO’s AirQ software and the US EPA’s BenMAP program, both released in the early 21st century, which quantify the health effects of ambient air pollution (AAP) [7].
AirQ has been one of the most extensively used software owing to its user-friendly interface, and technical and operational characteristics [6, 8, 9]. The AirQ software was first developed as a spreadsheet program in 1999. AirQ version 2.2.3, was published in 2004, and was replace by AirQ+ 1.0 in May 2016 (most recent update is AirQ+ 2.2.4 in March 2023) [10]). The comparison of studies over a period of more than two decades was possible although the key functionality and algorithms in all releases remained unchanged, thus, enabling comparability of assessments over a period. AirQ and AirQ+ estimate the effects of short-term changes in AAP (based on risk estimates from time-series studies), and the effects of long-term exposure (based on risk estimates from cohort studies). The releases differ in the operating systems supported, the user interface, and default settings. For instance, AirQ+ does not provide default baseline incidence (BI) unlike AirQ [10].
There are four key pieces of input information necessary to estimate the health effects of AAP using computer-based tools [6, 7, 9]: [1] AP data [2]; demographic data of the exposed population [3]; health-related data including baseline death and disease rates; and [4] a CRF/ERF based on epidemiological studies. Publicly available HRA tools like AirQ and AirQ+ can be used by individuals with varying expertise, potentially leading to unreliable results due to inaccurate input parameters. This paper aims to review HRAs of AP using these tools, as reported in scientific literature until December 31, 2022, and provide best practice guidance for future assessments.
Methods
Search Strategy
We conducted a systematic literature review following the Preferred Reporting and Items for Systematic Review and Meta-Analysis (PRISMA) (Figure 1) [11]. We reviewed literature published in print and indexed in databases from inception until 31 December 2022. The literature search was performed systematically in PubMed, Web of Science Core Collection, and Scopus using three key components (“exposure,” “health effects,” and “software”) along with their corresponding keywords (as outlined in Supplementary Table S1). Furthermore, we conducted a search on Google Scholar, albeit not in a completely systematic manner, to find studies that were not listed in the aforementioned bibliographic databases [12]. Finally, we hand-searched records identified in the references of retrieved papers [12].
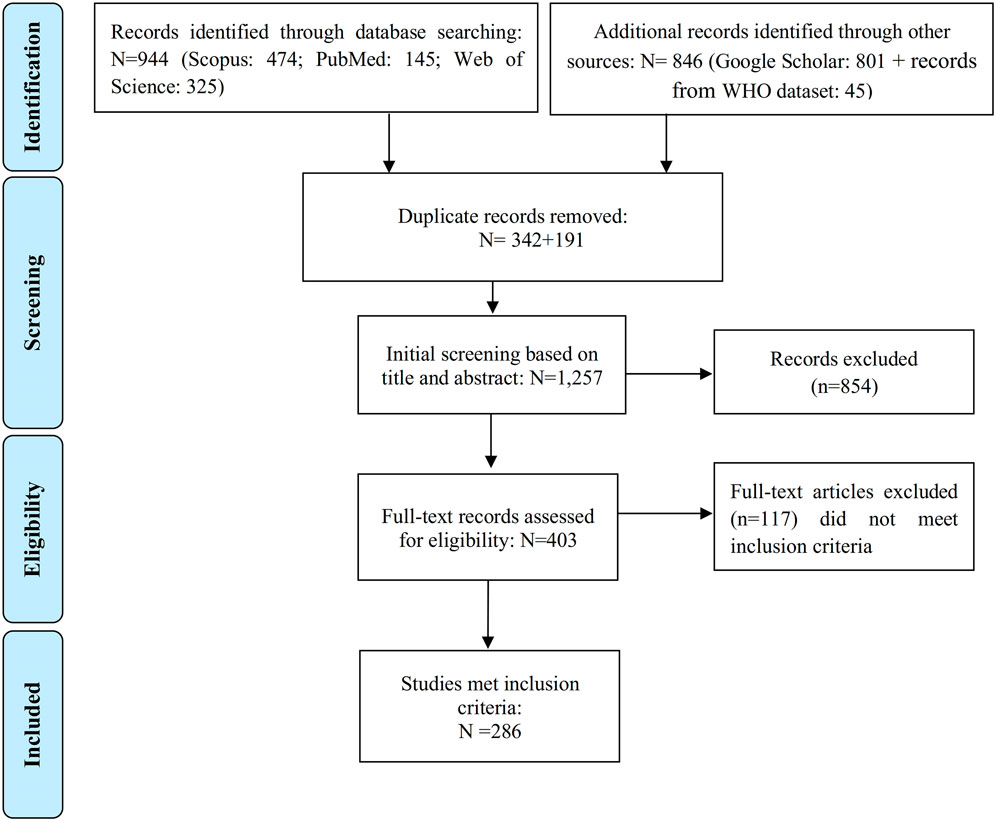
Figure 1. Flowchart demonstrating the steps involved in the literature search (Global, no restriction on start date-2022).
We also used a database from the WHO Regional Office for Europe in which the studies estimating the health effect of AAP using AirQ (all versions of the software) were collected (these have not been collected in a systematic manner as well). The WHO database included many non-English publications, such as reports and theses that complemented our final database.
Study Inclusion and Exclusion Criteria
Studies were included without language restriction if: 1) they were full-length peer-reviewed original articles, reports, or published theses; and 2) they reported on classical regulated air pollutants (PM10, PM2.5, NO2, O3, SO2, and CO) using AirQ 2.2.3, its previous versions and AirQ+. Studies were excluded if no full-text was available (e.g., conference abstracts).
Article Selection and Data Extraction
Two co-authors (F.Y. and S.F.) independently screened titles and abstracts of all articles identified in the literature search. Duplicates were removed. If the title and abstract of papers did not provide sufficient detail for a decision, the full text of the articles was reviewed. Any discrepancies in the decision to include a study between them were resolved by a third co-author (H.A.), with discussion until a consensus was reached. The data extracted included year of publication, location (city or country of the study), WHO region, study duration, health outcome(s) addressed, air pollutants used (type and source of air quality data), duration of exposure (long- or short-term), baseline incidence (BI), and the relative risk data. We also recorded the results of our critical evaluation of the papers considering the following research questions (RQ):
• (RQ1): Was the source of air quality data provided? If yes, which types of data were used (air quality monitoring stations (AQMSs), self-measured, AQMSs + modeling, or satellite data?), and if AQMSs were the data source, what type (s) of AQMSs (e.g., traffic, background, etc.) were used?
• (RQ2): Were the air quality data coverage (daily or hourly) and their data processing/validation described?
• (RQ3): Were the exposed population and the source of their demographic data reported?
• (RQ4): Was there any information about the source of the health data? If yes, was the information extracted from an international, national, or local database?
Results
Literature Review Results
The initial search provided 944 records (Figure 1). We further identified 801 records from the Google Scholar database, and an additional 45 records were extracted from the WHO database (articles, reports, theses, and book chapters not identified by bibliographic databases and Google Scholar search). After removing 533 duplicate records out of the total 1,790 initial records, the titles and abstracts of the remaining 1,257 papers were reviewed. Out of these, 854 were found to be unrelated to the purpose of the study and were further excluded. Full texts of the remaining 403 records were reviewed, from which 286 met the inclusion criteria.
Of those 286 selected records identified as meeting the inclusion criteria (241 from the PubMed, Scopus, Web of Sciences, and Google Scholar databases, plus 45 from the WHO database), 241 were published in scientific peer-reviewed journals, or as theses. Most of the publications were in English (Supplementary Figure S1), while some studies were in Persian [13], Italian [14], Spanish [6], French [3], German [2], Polish [2], Czech [2], Estonian [2], Turkish [2], Croatian [1], Portuguese [1], Japanese [1], and Hungarian [1]. The Persian records were assessed by two co-authors who are Persian native speakers (F.Y. and S.F.), while the papers published in other languages were assessed by one of the authors (P.M. supported by experts who could extract information from other languages). Supplementary Tables S2, S3 provide a summary of the included studies that used AirQ and AirQ+ for HRA from 1 January 2002, to 31 December 2022.
Publications by Year
The temporal distribution of the included studies using AirQ and AirQ+ between 2002 and 2022 is presented in Figure 2. Out of the 286 selected publications, 198 used AirQ and 88 used AirQ+. The year with the largest number of publications was 2016 for AirQ (39 publications), and 2021 for AirQ+ (27 publications), representing approximately 20% and 31% of the total publications, respectively. The start of the decline in publications using AirQ from 2016 onwards is likely due to the release of AirQ+ in that year. However, even in 2021 and 2022 AirQ was used in a few studies [14–23]. One study reported that they had used AirQ+ (v3.0) to estimate health effects in cities of France, Iran, and Italy, but such a version has not been released by WHO to date, and it is possible that it was a typo.
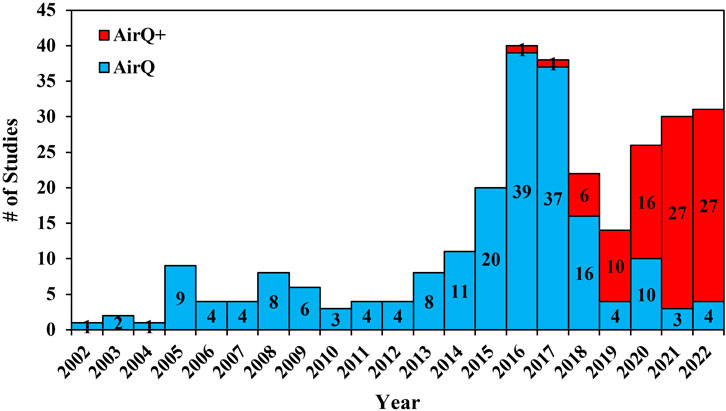
Figure 2. Temporal distribution of publications using all versions of AirQ and AirQ+ software (Global, 2002–2022).
Publications by Country and WHO Region
More than half (57% out of 286) of the studies that used AirQ or AirQ+ were conducted in Iran (Figure 3; Supplementary Figure S2). For AirQ, out of the final studies included, 133 (67%) focused on Iran, followed by Italy (20 studies, 10%), India (five studies, 2.5%), France, Spain, Poland, and Croatia (three studies each). Further, 14 studies used AirQ in Austria, Bolivia, China, Czechia, Estonia, Greece, and Lithuania (two studies in each country). AirQ was used in one study in each of the following countries: Egypt, Germany, Hungary, Japan, Kyrgyzstan, Peru, Portugal, South Korea, Sri Lanka, Sweden, Thailand, Taiwan, and the UK. One study estimated the health effects of AAP in 23 European and Middle Eastern cities in Greece, Spain, France, Romania, Hungary, Slovenia, Poland, Sweden, England, Italy, and Israel (Figure 3; Supplementary Figure S2). AirQ has been applied primarily in the WHO Eastern Mediterranean Region (67% of publications), followed by Europe (25%), Southeast Asia (4%), Western Pacific (3%), and the Americas (1%) region (Supplementary Figure S3). In those studies that used the AirQ+ software, 30 (34%) of studies focused on Iran, followed by India and Turkey with 18 and eight studies, respectively (Figure 3; Supplementary Figure S2). Compared to AirQ, a smaller proportion of AirQ+ users were from the WHO Eastern Mediterranean Region (30% of records), while there has been a substantial rise in the contribution of Western Pacific Region (25% in AirQ+ vs. 3% in AirQ) and South-East Asian Region (18% for AirQ+ vs. 4% for AirQ) (Supplementary Figure S3). Although the tool is widely used in many Central and South American countries (a Spanish version of the software was launched in February 2024), and is extensively applied in France, there is a clear sub-representation of the publications that have applied AirQ+.
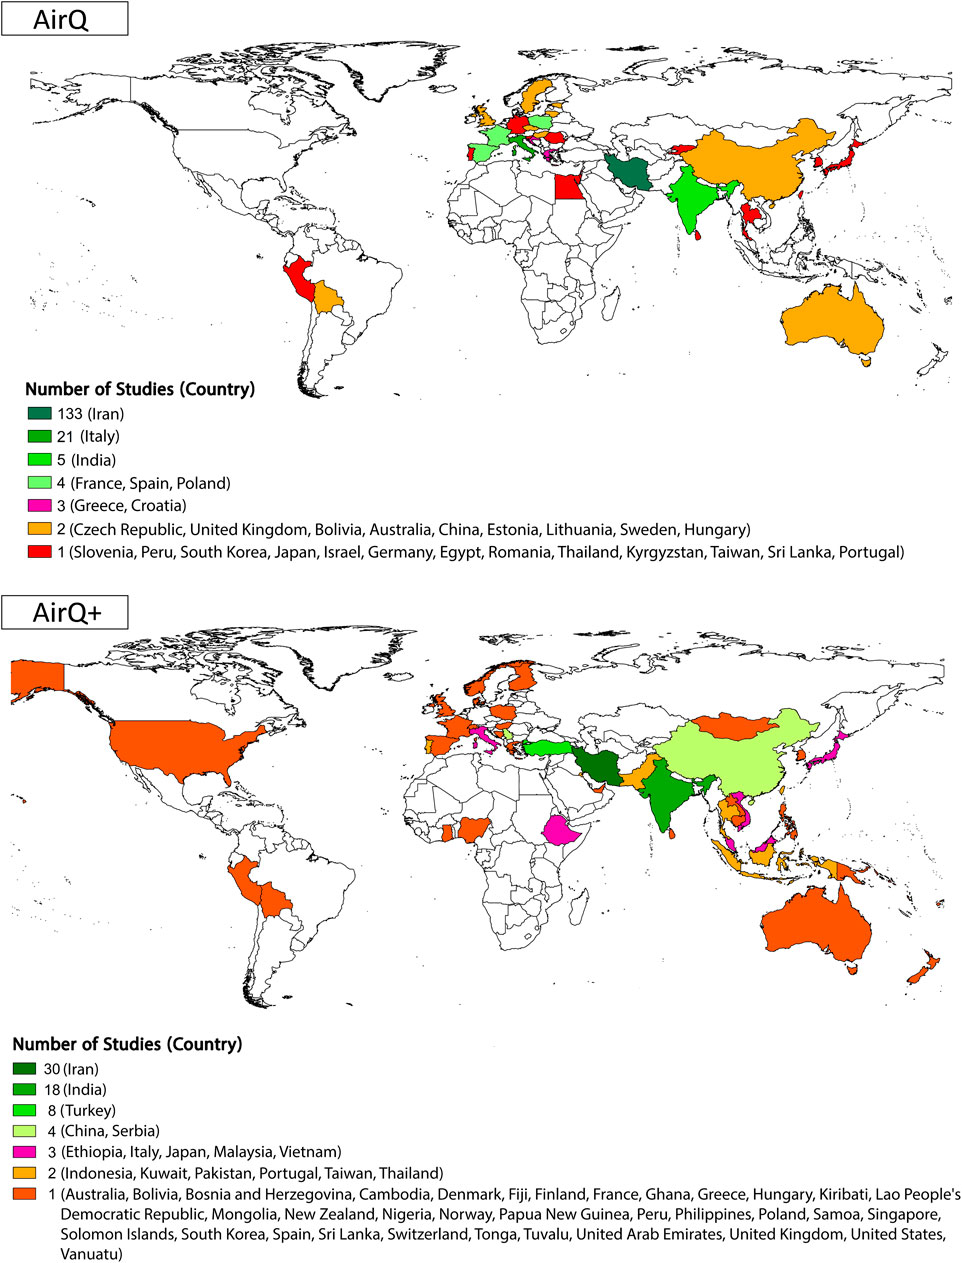
Figure 3. Geographic distribution and number of included studies by country [AirQ at the top and AirQ+ at the bottom; (Global, 2002–2022)].
Motivation of Conducted Studies
Around three-quarters of the studies using either AirQ or AirQ+ focused on research-related questions (Supplementary Figure S4, Supplementary Tables S2, S3), followed by policy planning (2% of studies that used AirQ and 15% for AirQ+), the impact assessment of sand and dust storms in various cities of Iran and Poland (14 studies using either AirQ or AirQ+) [15, 23–35], and assessment of the impact of COVID-19 on air quality and health (5 studies) [36–40]. Individual studies assessed the impact of AP episodes or extreme events, such as (Indian monsoon [13, 31] or large forest fires and megafires in the center region of Portugal [41]), and the use of residential wood combustion in cities of Sweden, Finland, Norway, and Denmark [42]. There is also an instance of the use of AirQ, on behalf of a civil society association, to conduct a study in opposition of the planned development of an incinerator in the Provincia di Lucca (Tuscany) in Italy [43].
Exposure Assessment
Air Quality Data
Since the key functionality and algorithms have not changed from AirQ to AirQ+, we assumed that differences in the use of the various software releases reflect changes in knowledge on AP health effects and research interests over time. Figure 4 illustrates the specific pollutants addressed in the selected studies from 2002 to 2022. From 2002 to 2022, most studies using these tools focused on the health effects of a single pollutant, with PM10 being the most studied in AirQ and PM2.5 in AirQ+. However, some studies investigated the effects of multiple pollutants. This shift towards PM2.5 reflects its increased data availability and recognized health impacts [44, 45]. The health impacts of PM10, O3, and NO2 were estimated by 23, 18 and 17 AirQ+ studies, respectively.
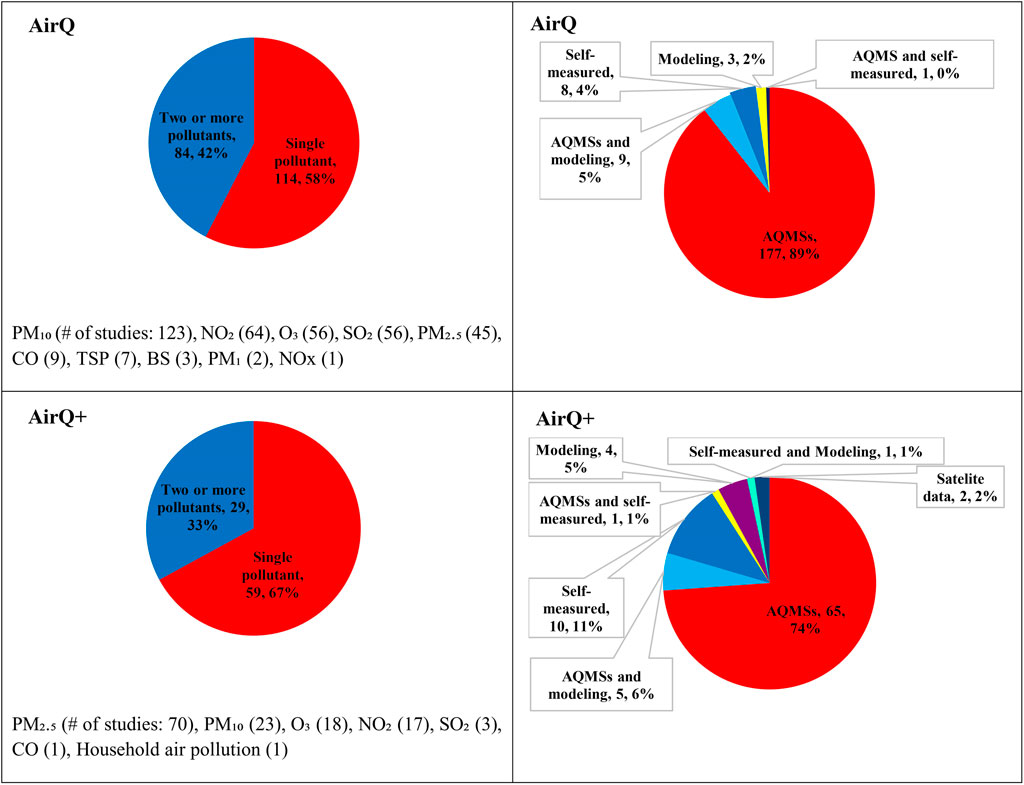
Figure 4. Numbers (percentage) of included studies using AirQ and AirQ+ software by air pollutant, and the source of air pollution data (Global, 2002–2022).
All studies stated the source of the AAP data that were used. Most of the AirQ studies (187) used ground-monitored air pollution concentrations from the regulatory monitoring network stations alongside modeled and self-measured data, while 8 studies reported they have conducted their own measurements [35, 46–52]. All but six studies that applied AirQ did not report which type of AQMSs were used [47, 53–57]. For AirQ+, 74% of the studies (65 out of 88) gathered AAP data from the AQMSs, and only 16 studies reported the types of AQMSs used (Supplementary Tables S2, S3) [25, 31, 36, 39, 41, 58–68].
Almost three-quarters of studies that used AirQ did not report the temporal coverage of the data (Supplementary Figure S5). The remaining studies reported that they only used the AQMS with >75%, 60%, or 50% completeness of the total hours in a year to calculate the short- or long-term exposure to AAP (Supplementary Table S2). Approximately, half of AirQ+ studies (40 out of 88) stated their AAP data coverage (Supplementary Figure S5). These studies mostly used the AQMSs with >75% completeness over a year to estimate the HRA of short- or long-term exposure to AP (Supplementary Table S3).
Nearly 80% of the studies that used AirQ or AirQ+, did not report air quality data processing and validation approaches (Supplementary Figure S6). As shown in Supplementary Tables S2, S3, the remaining studies that provided this information removed zero, negative, invalid and outlier values from the data set [25, 60, 64, 68–75], though none of them reported how the invalid or outlier data were identified. On the other hand, a few studies used a Z-score approach, which is a variation of scaling methods [8, 76–79], and defined other rules to identify and remove outlier values [76, 80].
Choice of Relative Risk (RR)
The RRs that have been applied to calculate the health risks attributed to air pollutants can be classified into the following five categories (Supplementary Figure S7; Supplementary Table S2):
• Previous study values: 74 studies (39%) reported that they utilized RR values from previous assessments. Furthermore, 5 studies used previous values of RR, AirQ default values, and RRs derived from European studies (like the APHEA study mentioned further below) in the same assessment. It should be highlighted that 58 of the 74 studies utilized a RR from the previous ones were conducted by Iranian researchers. Studies conducted by Iranian researchers mainly used the RR from the study of Naddafi and others (2012) [81], in which the authors have used the default RR in the AirQ software, a quantitative meta-analysis of peer-reviewed studies focused on European investigations, or directly from published studies on short-term effects, such as the APHEA (Air Pollution and Health: a European Approach) project. For example, two studies [54, 82] stated: “The RR values for ambient PM2.5 and PM10 were “borrowed” from a meta-analysis of 23 European cities because there has been no study for RR calculation in Iran.” The rest of the studies [18] reported that RRs were extracted directly from literature (e.g., APHEA) or were the recommended AirQ default RRs.
• AirQ software default values: Almost 25% of the studies have reported that they used the AirQ software default RR values.
• WHO study (meta-analysis and epidemiological), report, or database values: Approximately 23% of the studies (44 studies of which 38 were in Iran) used RR reported from WHO studies (meta-analysis and epidemiological ones), reports [83], and databases as the source of their RR values.
• Used national or local/regional values: About 2% of the studies used national and local/regional RR values from a single specific study.
• No data reported: 12% of the studies did not report the sources of RR values.
When comparing AirQ with AirQ+ studies in terms of RR (Supplementary Figure S7; Supplementary Table S3), 92% of AirQ+ studies have used the default RR values in the software; 83% of them stated that they used the RR of AirQ+ software and 9% have reported that they have utilized RR from the previously published HRA articles [42, 62, 63, 67, 84–87] (Supplementary Figure S7). The study [88], for instance, stated that “The default relative risk (RR) values available in the AirQ+ software for each health endpoint were retained for the analysis.” Only 8% of the studies did not report the source of RR.
Choice of Baseline Disease Incidence (BI)
The choices for BI values across studies were as follows (Supplementary Figure S8):
• 24% of studies used national/local BI values, and 25% of the studies utilized BI values from the previous studies, regardless of assessing their validity.
• 21% of the studies reported that they utilized BI values from WHO studies, data, and reports (Supplementary Figure S8).
• 18% of the studies did not report the source of BI values they used in their assessment.
• 10% of the studies applied AirQ software default BI values for quantifying premature deaths and hospital admissions due to cardiovascular and respiratory diseases related to AP.
In contrast to AirQ, AirQ+ does not provide default BI values (Supplementary Figure S8). Seven studies used international sources like the Institute for Health Metrics and Evaluation (IHME) database, or WHO data [20, 86, 88–92]. Nearly, 55% of AirQ+ studies used BI values obtained from local or national sources, which could be a good practice if high-quality data are available locally. 18 out of 88 studies did not report the source of BI values, and 14 studies used BI values from the previous studies. In one study [93], the BI value for all-cause mortality [42] was less than the BI value for ischemic heart disease (IHD) mortality, which was reported to be 112. Other researchers have commented on this error [94].
The BI rates differ between populations as the age structure, the environmental or behavioral stressors, and susceptibility of populations, among other factors, could be different. When a default BI value from the AirQ software is used, the estimated values (e.g., of premature deaths or hospital admissions) attributable to AAP exposures could be biased, if not adjusted for demographic differences.
Choice of Cut-Off/Counterfactual Values
The cut-off (or counterfactual) scenario used in the HRA analysis, fall into three main categories across studies: a) the default AirQ or AirQ+ software values, b) the national ambient standards in the countries where the studies were conducted, and c) missing information as the authors did not report these values (Supplementary Figure S9; Supplementary Tables S2, S3). In more than three-quarters of the AirQ studies (77%), users have reported the cut-off values, which is slightly higher than the AirQ+ users’ reporting rate of 72%. Among the 77% of studies reporting the cut-off values, 120 studies have used the counterfactual value of 10 μg/m³ for PM2.5. About 58% of the studies that used either AirQ or AirQ+ software were conducted in Iran, and across these, approximately all used the software default cut-off values. The detailed information regarding counterfactual value of other air pollutants is presented in Supplementary Tables S2, S3.
Population Age Groups
Most studies using AirQ and AirQ+ did not detail population data, such as age groups. They reported total population without age stratification. This can affect health effect calculations, as CRF and BI values should correspond to the relevant population segment. For example, using a larger population size than the underlying true one [93] for Tehran, Iran, led to a 35% overestimation of air pollution’s health burden [94].
Health Endpoints
In studies using the AirQ software, 53% investigated short-term exposure effects, while 7% explored long-term health impacts. In contrast, 57% of studies using AirQ+ estimated long-term health effects, compared to 17% that focused on short-term exposure. Notably, only 6% of AirQ+ studies did not report exposure duration, a significant improvement over the 23% using the AirQ version (Supplementary Figure S11). In the AirQ studies, all but one reported the number of cases, with 79% and 81% providing population attributable fraction (PAF) and the 95% confidence interval respectively (Supplementary Figures S12–S14). Among the studies using AirQ+, all reported the number of cases and their 95% confidence interval, while 63% also included the PAF (Supplementary Figures S12–S14).
Supplementary Figure S15 shows the health endpoints assessed with the AirQ and AirQ+ software. All-cause mortality was the main health outcome assessed due to the availability of BI data, and the robust epidemiological evidence. Most studies estimated more than one health endpoint. In the AirQ studies, cardiovascular disease mortality was the most studied outcome, included by 138 studies, followed by all-cause mortality (131), respiratory mortality (116), and lung cancer (LC) mortality [4]. For studies that used the AirQ+ software, the majority investigated all-cause mortality (104 studies), followed by chronic obstructive pulmonary disease, ischemic heart disease, LC, stroke, and respiratory mortality by 39, 36, 32, 31, and 29 studies, respectively.
Sensitivity or Comparative Analysis
In the studies utilizing the AirQ software, nine (5%) have conducted a sensitivity or comparative risk analysis, while only eight (9%) studies have performed a sensitivity assessment using AirQ+ [85, 95–97]. The remaining studies have not reported sensitivity assessment (Supplementary Figure S16). In the two studies [9, 85], the authors compared the output from AirQ+ and BenMAP–CE (software versions not reported by the authors), considering different choices of the input parameters for air quality, demographic and mortality statistics (BI data), and CRFs (RR and counterfactual value). The comparative analysis showed that both models gave consistent health impact assessment results. In the study conducted by Al-Hemoud and others [95], the authors calculated the preventable premature deaths if the current ambient PM2.5 concentration in Kuwait would be reduced to the WHO Interim Target-1 (35 μg/m3) for the years 2025–2035 and 2045 and considered these estimates as a sensitivity analysis. However, they did not disclose the method used to determine BI, a crucial factor in assessing the health impact due to AAP for the years 2025, 2035, and 2045. Also, Y.A. Aliyu and J.O. Botai (2018) estimated and compared health effects of PM2.5 and PM10 using two different RRs; WHO AirQ+ default and based on multiple analysis of peer-reviewed findings conducted in Asia [66]. In the study of Ebrahimi and others [96], the health burden attributable to ambient NO2 concentrations in Tehran using AirQ+ was compared to predictions using the WANN (wavelet transformation and wavelet neural network) approach. They reported that “analyzing the sensitivity of mortality resulted from NO2 concentration was done by using of wavelet neural network and AirQ+ software, and it was concluded that the increase or decrease in the parameters affecting NO2 concentration will affect the mortality rate” [96].
Discussion
Due to compelling evidence of AP health effects, there is an increasing interest in monitoring and modeling the health effects. From the analysis of published papers and reports using the AirQ and AirQ+ HRA tools, we learned useful lesson that can be beneficial in future applications. Our critical appraisal of published literature revealed serious reporting issues on all input data categories. The most common deficiencies included poor reporting of AP exposure data and its quality (data coverage and validity, monitoring station types), and/or poor reporting of epidemiological data with justifications for the choices that were made, e.g., population size, CRF, BI, AP scenarios, associations of interest, and lack of conducting uncertainty assessment.
Examples For the Significance of Input Data in Estimating the Health Effects of AAP
To demonstrate the significance of some of input data in estimating the health effects of AAP, we utilized WHO AirQ+ (v.2.2) software [10]. We modified certain input parameters, including annual mean of ambient PM2.5 concentration and BI (in hypothetical cities in the United States and Iran) by 10%–20%, and calculated all-cause mortality (Supplementary Figures S17–20). We used two categories of annual mean of ambient PM2.5 concentrations; high (a hypothetical city in Iran) and low (a hypothetical city in the Unites States) based on the concentrations observed in Iran (30–45 μg m−3) and the Unites States (6–10 μg m−3) in 2019, respectively (Tables 1, 2).
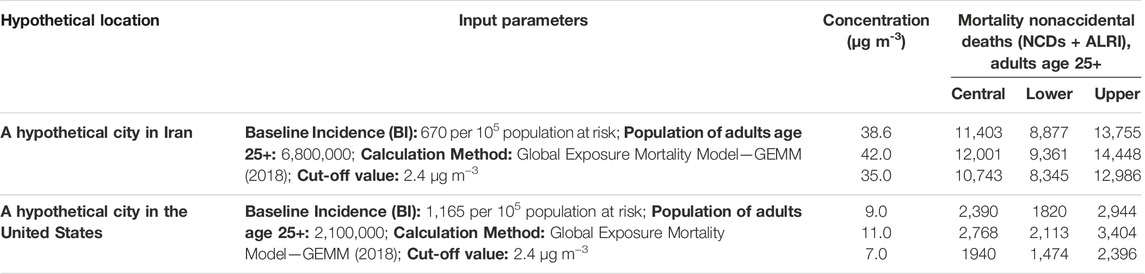
Table 1. The number of all-cause mortality for adults (aged 25+ years) by changing the annual mean of
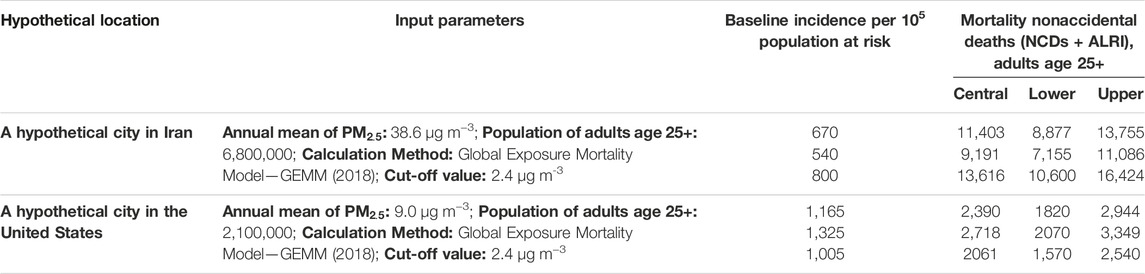
Table 2. The number of all-cause mortality for adults (aged 25+ years) by changing the baseline incidence per 105 population at risk (for hypothetical cities in Iran and the United States, 2019).
By changing the annual mean of ambient PM2.5 concentrations from 38.6 μg m−3–42 μg m−3 or 35 μg m−3 (Table 1), the number of attributed premature deaths changed from 11,403 (95% CI: 8,877; 13,755) to 12,001 (95% CI: 9,361; 14,448) and 10,743 (95% CI: 8,345; 12,986), respectively. For low category of annual mean of ambient PM2.5 concentrations, by changing it from 9 μg m−3–11 μg m−3 or 7 μg m−3, the number of attributable cases changed from 2,390 (95% CI: 1,820; 2,944) to 2,768 (95% CI: 2,113; 3,404) and 1,940 (95% CI: 1,474; 2,396), respectively (Table 1).
With respect to BI for all-cause mortality (Table 2), at the annual mean concentrations of ambient PM2.5 38.6 μg m−3, by changing it from 670 to 540 or 800, the number attributable cases changed from 11,403 (95% CI: 8,877; 13,755) to 9,191 (95% CI: 7,155; 11,086) and 13,616 (95% CI: 10,600; 16,424), respectively. At the annual mean concentrations of ambient PM2.5 9 μg m−3, by changing BI from 1,165 to 1,005 or 1,325, the number of attributable cases changed from 2,390 (95% CI: 1,820; 2,944) to 2,061 (95% CI: 1,570; 2,540) and 2,718 (95% CI: 2070, 2,070; 3,349), respectively (Table 2). As a result, inaccurate information on the ambient air quality data and BI can result in some degree of uncertainties affecting the AAP-related health effects.
Proposals for Good Practice
We propose that a good practice for impact assessment of AP should include:
• Clear definitions of the scope, motivation, and objectives, e.g., HRA or BoD (burden of disease) assessment, including the population size (with age-groups of interest), air pollutants of interest, AP exposure data source, (with data quality and coverage across time, data cleaning plans and procedures, data validation) and clear, justification for choices made, especially for CRF/ERF, BI, the exposure scenarios, the health outcomes of interest, uncertainty assessment procedures, and the stakeholders involved/targeted.
• Use of reliable and representative sources of data, such as population data, mortality/morbidity rates, monitoring stations, or validated estimates from satellite data, or modelling outputs, to ensure their quality and validity.
• Selection of appropriate CRF/ERF (such as available ones in the AirQ+ software), based on the health outcomes and pollutants of interest. The CRF/ERF should be consistent with the available evidence and reflect the uncertainty and variability in the estimates, as well as be applicable over the range of exposures considered by the analysis.
• Estimation of the attributable number of cases of mortality/morbidity due to AP for each exposure scenario and health outcome as well as presenting PAF and attributable mortality/morbidity.
• Interpretation and communication of the results of the HRA, considering the limitations, assumptions, and uncertainties of the analysis. The results should be presented in a clear and transparent way, using tables, graphs, maps, or other visual aids and should also be discussed in relation to the policy context, the stakeholders’ interests, and the ethical implications of the HRA.
• Communication and dissemination of the findings of the HRA or BoD assessment to the scientific community, the relevant stakeholders and decision-makers, or media and the general public. If feasible, we recommend openly publishing the data in the analysis, as Supplementary Material across the articles or reports to ensure transparency and replicability.
• Use of clear and concise language and visual aids to convey the main messages and implications.
• Evaluation and monitoring the HRA process and outcomes, including the methods, data, results, and impacts.
• Identify and report the strengths and weaknesses of the HRA and provide feedback for future improvements.
• Also, proposing detailed guidelines and offering training courses on HRA of AP, using AirQ+ or other tools, has been shown to deliver the greatest benefit to new users of health risk assessment tools [9].
By following the proposed steps, the impact assessment of AP using AirQ+ or other software, can be a powerful tool to inform policymakers and stakeholders, and support evidence-based decisions to protect and promote public health.
Strengths and Limitations
Our study involving databases PubMed, Web of Science Core Collection, and Scopus forms a systematic review with no language restrictions. We are assured that we have discovered all English and non-English studies published and indexed in these databases from inception until 31 December 2022. An additional 801 records were identified through our Google Scholar search, again without any language restrictions. The WHO database also contained numerous non-English studies. Anyhow, albeit we have gathered and incorporated most of the studies related to AirQ and AirQ+, there is a possibility that we might have overlooked some records (especially non-English) that were not among the 801 records retrieved on Google Scholar.
Author Contributions
Conceptualization: HA and PM. Data collection: HA, FY, SF, EC, and PM. Formal analysis: HA, FY, and SF. Validation: HA. Writing original draft: HA, FY, SF, and PM. Writing–review and editing: All authors. All authors contributed to the article and approved the submitted version.
Funding
This study was made possible by the support from the Federal Ministry for Environment, Nature Conservation and Nuclear Safety of Germany and the Ministry of Environment of the Republic of Korea. HA was supported by the US National Institutes of Health (grants: UL1TR004419 and by P30ES023515).
Author Disclaimer
CG, and PM and KC-M are staff member of the World Health Organization (WHO). This paper reflects the authors’ views. The authors alone are responsible for the views expressed in this publication, and they do not necessarily represent the views, decisions, or policies of the WHO.
Conflict of Interest
The authors declare that they do not have any conflicts of interest.
Supplementary Material
The Supplementary Material for this article can be found online at: https://www.ssph-journal.org/articles/10.3389/phrs.2024.1606969/full#supplementary-material
References
1. WHO. WHO Global Air Quality Guidelines: Particulate Matter (PM2. 5 and PM10), Ozone, Nitrogen Dioxide, Sulfur Dioxide and Carbon Monoxide. Bonn, Germany: World Health Organization (2021).
2. GBD 2019 Risk Factors Collaborators. Global Burden of 87 Risk Factors in 204 Countries and Territories, 1990–2019: A Systematic Analysis for the Global Burden of Disease Study 2019. The Lancet (2020) 396(10258):1223–49. doi:10.1016/S0140-6736(20)30752-2
3. Evangelopoulos, D, Perez-Velasco, R, Walton, H, Gumy, S, Williams, M, Kelly, FJ, et al. The Role of Burden of Disease Assessment in Tracking Progress Towards Achieving WHO Global Air Quality Guidelines. Int J Public Health (2020) 65(8):1455–65. doi:10.1007/s00038-020-01479-z
4. Burnett, R, Chen, H, Szyszkowicz, M, Fann, N, Hubbell, B, Pope, CA, et al. Global Estimates of Mortality Associated With Long-Term Exposure to Outdoor Fine Particulate Matter. Proc Natl Acad Sci (2018) 115(38):9592–7. doi:10.1073/pnas.1803222115
5. Castro, A, Röösli, M, de Hoogh, K, Kappeler, R, Kutlar Joss, M, Vienneau, D, et al. Methods Matter: A Comparative Review of Health Risk Assessments for Ambient Air Pollution in Switzerland. Public Health Rev (2022) 43:1604431. doi:10.3389/phrs.2022.1604431
6. Anenberg, SC, Belova, A, Brandt, J, Fann, N, Greco, S, Guttikunda, S, et al. Survey of Ambient Air Pollution Health Risk Assessment Tools. Risk Anal (2016) 36(9):1718–36. doi:10.1111/risa.12540
7. Sacks, JD, Lloyd, JM, Zhu, Y, Anderton, J, Jang, CJ, Hubbell, B, et al. The Environmental Benefits Mapping and Analysis Program–Community Edition (BenMAP–CE): A Tool to Estimate the Health and Economic Benefits of Reducing Air Pollution. Environ Model Softw (2018) 104:118–29. doi:10.1016/j.envsoft.2018.02.009
8. Yousefian, F, Faridi, S, Azimi, F, Aghaei, M, Shamsipour, M, Yaghmaeian, K, et al. Temporal Variations of Ambient Air Pollutants and Meteorological Influences on Their Concentrations in Tehran During 2012–2017. Scientific Rep (2020) 10(1):292–11. doi:10.1038/s41598-019-56578-6
9. Corso, M, Lagarrigue, R, and Medina, S. Pollution Atmosphérique. Guide Pour la Réalisation d’une Evaluation Quantitative des Impacts sur la Santé (EQIS). EQIS Avec une Exposition Mesurée. Santé Publique France (2019) 92.
10. WHO. AirQ+: Software Tool for Health Risk Assessment of Air Pollution (2023). Available from: https://www.who.int/europe/tools-and-toolkits/airq---software-tool-for-health-risk-assessment-of-air-pollution. (Accessed December 15, 2023)
11. Moher, D, Liberati, A, Tetzlaff, J, Altman, DG, and Group, P. Preferred Reporting Items for Systematic Reviews and Meta-Analyses: The PRISMA Statement. Int J Surg (2010) 8(5):336–41. doi:10.1016/j.ijsu.2010.02.007
12. Faridi, S, Krzyzanowski, M, Cohen, AJ, Malkawi, M, Moh’d Safi, HA, Yousefian, F, et al. Ambient Air Quality Standards and Policies in Eastern Mediterranean Countries: A Review. Int J Public Health (2023) 68:1605352. doi:10.3389/ijph.2023.1605352
13. Sasmita, S, Kumar, DB, and Priyadharshini, B. Assessment of Sources and Health Impacts of PM10 in an Urban Environment Over Eastern Coastal Plain of India. Environ Challenges (2022) 7:100457. doi:10.1016/j.envc.2022.100457
14. Xu, C, Zhang, Z, Ling, G, Wang, G, and Wang, M. Air Pollutant Spatiotemporal Evolution Characteristics and Effects on Human Health in North China. Chemosphere (2022) 294:133814. doi:10.1016/j.chemosphere.2022.133814
15. Tahery, N, Geravandi, S, Goudarzi, G, Shahriyari, HA, Jalali, S, and Mohammadi, MJ. Estimation of PM10 Pollutant and its Effect on Total Mortality (TM), Hospitalizations Due to Cardiovascular Diseases (HACD), and Respiratory Disease (HARD) Outcome. Environ Sci Pollut Res (2021) 28(17):22123–30. doi:10.1007/s11356-020-12052-9
16. Bonyadi, Z, Arfaeinia, H, Fouladvand, M, Farjadfard, S, Omidvar, M, and Ramavandi, B. Impact of Exposure to Ambient Air Pollutants on the Admission Rate of Hospitals for Asthma Disease in Shiraz, Southern Iran. Chemosphere (2021) 262:128091. doi:10.1016/j.chemosphere.2020.128091
17. Asl, FB, Leili, M, Vaziri, Y, Arian, SS, Cristaldi, A, Conti, GO, et al. Health Impacts Quantification of Ambient Air Pollutants Using AirQ Model Approach in Hamadan, Iran. Environ Res (2018) 161:114–21. doi:10.1016/j.envres.2017.10.050
18. Bonyadi, Z, Arfaeinia, H, Ramavandi, B, Omidvar, M, and Asadi, R. Quantification of Mortality and Morbidity Attributed to the Ambient Air Criteria Pollutants in Shiraz City, Iran. Chemosphere (2020) 257:127233. doi:10.1016/j.chemosphere.2020.127233
19. Luo, H, Guan, Q, Lin, J, Wang, Q, Yang, L, Tan, Z, et al. Air Pollution Characteristics and Human Health Risks in Key Cities of Northwest China. J Environ Manage (2020) 269:110791. doi:10.1016/j.jenvman.2020.110791
20. Tabibzadeh, SAS, Hosseini, SA, Mohammadi, P, Etminan, A, and Norouzi, H. Quantification of Mortality Associated With Particulate Matter Using Air Q Model in Ambient Air in Shiraz, Iran. Polish J Environ Stud (2022) 31(1):551–9. doi:10.15244/pjoes/139328
21. Borsi, SH, Goudarzi, G, Sarizadeh, G, Dastoorpoor, M, Geravandi, S, Shahriyari, HA, et al. Health Endpoint of Exposure to Criteria Air Pollutants in Ambient Air of on a Populated in Ahvaz City, Iran. Front Public Health (2022) 10:869656. doi:10.3389/fpubh.2022.869656
22. Fard, RF, Torkamani, FD, Mahvi, AH, Fahiminia, M, Koolivand, A, Hosseini, MR, et al. Health Effects From Particulate Air Pollution in One of the Industrial Cities of Iran. J Air Pollut Health (2021) 6(2):135–48. doi:10.18502/japh.v6i2.7955
23. Toolabi, A, Bonyadi, Z, and Ramavandi, B. Health Impacts Quantification Attributed to Ambient Particulate Matter in the Nearest Iranian City to the Main Dust Source. Environ Monit Assess (2022) 194(9):666. doi:10.1007/s10661-022-10329-9
24. Eskandari, Z, Maleki, H, Neisi, A, Riahi, A, Hamid, V, and Goudarzi, G. Temporal Fluctuations of PM(2.5) and PM(10), Population Exposure, and Their Health Impacts in Dezful City, Iran. J Environ Health Sci Eng (2020) 18(2):723–31. doi:10.1007/s40201-020-00498-5
25. Hadei, M, Shahsavani, A, Krzyzanowski, M, Querol, X, Stafoggia, M, Nazari, SSH, et al. Burden of Mortality Attributed to PM2. 5 Exposure in Cities of Iran; Contribution of Short-Term Pollution Peaks. Atmos Environ (2020) 224:117365. doi:10.1016/j.atmosenv.2020.117365
26. Goudarzi, G, Daryanoosh, S, Godini, H, Hopke, P, Sicard, P, De Marco, A, et al. Health Risk Assessment of Exposure to the Middle-Eastern Dust Storms in the Iranian Megacity of Kermanshah. Public health (2017) 148:109–16. doi:10.1016/j.puhe.2017.03.009
27. Omidi Khaniabadi, Y, Daryanoosh, S, Amrane, A, Polosa, R, Hopke, P, Goudarzi, G, et al. Impact of Middle Eastern Dust Storms on Human Health. Atmos Pollut Res (2016) 8:606–13. doi:10.1016/j.apr.2016.11.005
28. Khaniabadi, YO, Fanelli, R, De Marco, A, Daryanoosh, SM, Kloog, I, Hopke, PK, et al. Hospital Admissions in Iran for Cardiovascular and Respiratory Diseases Attributed to the Middle Eastern Dust Storms. Environ Sci Pollut Res Int (2017) 24(20):16860–8. doi:10.1007/s11356-017-9298-5
29. Behrouzi Rad, B, Mohammadi, MJ, Geravandi, S, Yari, AR, Sadeghi, S, and Zallaghi, E. Investigation of Years of Life Lost Caused by Dust Storm in Western Part of Iran. Arch Hyg Sci (2017) 6(2):221–8. doi:10.29252/archhygsci.6.2.221
30. Omidi Khaniabadi, Y, Geravandi, S, Mahboubi, M, Mohammadi, M, Momtazan, M, Daryanoosh, S, et al. Association of Hospitalizations for Cardiovascular Disease Attributed to Dust Events. Arvand J Health Med Sci (2017). doi:10.22631/ajhms.2017.92845.1022
31. Sówka, I, Nych, A, Kobus, D, Bezyk, Y, and Zathey, M. Analysis of Exposure of Inhabitants of Polish Cities to Air Pollution With Particulate Matters With Application of Statistical and Geostatistical Tools. E3S Web of Conferences (2019) 100:8. doi:10.1051/e3sconf/201910000075
32. Marzouni, MB, Moradi, M, Zarasvandi, A, Akbaripoor, S, Hassanvand, MS, Neisi, A, et al. Health Benefits of PM(10) Reduction in Iran. Int J biometeorology (2017) 61(8):1389–401. doi:10.1007/s00484-017-1316-2
33. Marzouni, MB, Alizadeh, T, Banafsheh, MR, Khorshiddoust, AM, Ghozikali, MG, Akbaripoor, S, et al. A Comparison of Health Impacts Assessment for PM10 During Two Successive Years in the Ambient Air of Kermanshah, Iran. Atmos Pollut Res (2016) 7(5):768–74. doi:10.1016/j.apr.2016.04.004
34. Maleki, H, Sorooshian, A, Goudarzi, G, Nikfal, AH, and Baneshi, MM. Temporal Profile of PM10 and Associated Health Effects in One of the Most Polluted Cities of the World (Ahvaz, Iran) Between 2009 and 2014. Aeolian Res (2016) 22:135–40. doi:10.1016/j.aeolia.2016.08.006
35. Nourmoradi, H, Omidi Khaniabadi, Y, Goudarzi, G, Daryanoosh, SM, Khoshgoftar, M, Omidi, F, et al. Air Quality and Health Risks Associated With Exposure to Particulate Matter: A Cross-Sectional Study in Khorramabad, Iran. Health Scope (2016) 5(2):e31766. doi:10.17795/jhealthscope-31766
36. Dragic, N, Bijelovic, S, Jevtic, M, Velicki, R, and Radic, I. Short-Term Health Effects of Air Quality Changes During the COVID-19 Pandemic in the City of Novi Sad, the Republic of Serbia. Int J Occup Med Environ Health (2021) 34(2):223–37. doi:10.13075/ijomeh.1896.01784
37. Goel, A, Saxena, P, Sonwani, S, Rathi, S, Srivastava, A, Bharti, AK, et al. Health Benefits Due to Reduction in Respirable Particulates During COVID-19 Lockdown in India. Aerosol Air Qual Res (2021) 21(5):200460. doi:10.4209/aaqr.200460
38. Markandeya, , Verma, PK, Mishra, V, Singh, NK, Shukla, SP, and Mohan, D. Spatio-Temporal Assessment of Ambient Air Quality, Their Health Effects and Improvement During COVID-19 Lockdown in One of the Most Polluted Cities of India. Environ Sci Pollut Res Int (2021) 28(9):10536–51. doi:10.1007/s11356-020-11248-3
39. Lam, YF, Chang, JMH, Loo, BPY, Zhang, HS, Leung, KKM, and Axhausen, KW. Screening Approach for Short-Term PM2.5 Health Co-Benefits: A Case Study From 15 Metropolitan Cities Around the World During the COVID-19 Pandemic. Atmosphere (2022) 13(1):18. doi:10.3390/atmos13010018
40. Manoj, MG, Satheesh Kumar, MK, Valsaraj, KT, Vijayan, SK, and Nishanth, T. Exacerbation of Fatality Rates Induced by Poor Air Quality Due to Open-Air Mass Funeral Pyre Cremation During the Second Wave of COVID-19. Toxics (2022) 10(6):306. doi:10.3390/toxics10060306
41. Oliveira, M, Delerue-Matos, C, Pereira, MC, and Morais, S. Environmental Particulate Matter Levels During 2017 Large Forest Fires and Megafires in the Center Region of Portugal: A Public Health Concern? Int J Environ Res Public Health (2020) 17(3):1032. doi:10.3390/ijerph17031032
42. Orru, H, Olstrup, H, Kukkonen, J, López-Aparicio, S, Segersson, D, Geels, C, et al. Health Impacts of PM(2.5) Originating From Residential Wood Combustion in Four Nordic Cities. BMC public health (2022) 22(1):1286. doi:10.1186/s12889-022-13622-x
43. Vitolo, S. Relazione Finale [Final report]. on Behalf of the “Comitato per l’Inchiesta Pubblica Nell’Ambito Della Procedura di Valutazione Dell’Impatto Ambientale del Progetto dell’Impianto di Co-Incenerimento a Servizio Degli Stabilimenti Cartari di Diecimo e Porcari della Ditta Cartiera Lucchese S.p.A.” (2009). Available from: http://www.comune.borgoamozzano.lucca.it/upload/file/UFFICIO%20STAMPA/Parere_conclusivo_Sandra_Vitolo.pdf.
44. Lu, F, Xu, D, Cheng, Y, Dong, S, Guo, C, Jiang, X, et al. Systematic Review and Meta-Analysis of the Adverse Health Effects of Ambient PM2. 5 and PM10 Pollution in the Chinese Population. Environ Res (2015) 136:196–204. doi:10.1016/j.envres.2014.06.029
45. Yorifuji, T, Bae, S, Kashima, S, Tsuda, T, Honda, Y, Kim, H, et al. Health Impact Assessment of PM10 and PM2. 5 in 27 Southeast and East Asian Cities. J Occup Environ Med (2015) 57(7):751–6. doi:10.1097/JOM.0000000000000485
46. Fattore, E, and Paiano, V. Il Rischio Sanitario in Relazione Alla Qualità Dell’Aria. Ricerca & Pratica (2008) 24(6). doi:10.1707/402.4729
47. Gholampour, A, Nabizadeh, R, Naseri, S, Yunesian, M, Taghipour, H, Rastkari, N, et al. Exposure and Health Impacts of Outdoor Particulate Matter in Two Urban and Industrialized Area of Tabriz, Iran. J Environ Health Sci Eng (2014) 12(1):27–10. doi:10.1186/2052-336X-12-27
48. Shahsavani, A, Naddafi, K, Haghighifard, NJ, Mesdaghinia, A, Yunesian, M, Nabizadeh, R, et al. The Evaluation of PM10, PM2. 5, and PM1 Concentrations During the Middle Eastern Dust (MED) Events in Ahvaz, Iran, From April Through September 2010. J arid environments (2012) 77:72–83. doi:10.1016/j.jaridenv.2011.09.007
49. Nourmoradi, H, Goudarzi, G, Daryanoosh, SM, Omidi-Khaniabadi, F, Jourvand, M, and Omidi-Khaniabadi, Y. Health Impacts of Particulate Matter in Air Using AirQ Model in Khorramabad City, Iran. J Basic Res Med Sci (2015) 2(2):44–52.
50. Zallaghi, E, Shirmardi, M, Soleimani, Z, Goudarzi, G, Heidari-Farsani, M, Al-Khamis, G, et al. Assessment of Health Impacts Attributed to PM10 Exposure During 2011 in Kermanshah City, Iran. J Adv Environ Health Res (2014) 2(4):242–50. doi:10.22102/JAEHR.2014.40175
51. Geravandi, S, Zalaghi, E, Goudarzi, G, Mohammadi, MJ, Babaei, AA, Yari, AR, et al. Exposure to Particulate Matter of Less Than 10 Microns and its Effect on Respiratory and Cardiovascular Diseases in Isfahan, Iran in 2013. Health Syst Res (2016) 11(4):725–30.
52. Mohammed, AM, Ibrahim, YH, and Saleh, IA. Estimation of Hospital Admission Respiratory Disease Cases Attributed to Exposure to SO2 and NO2 in Two Different Sectors of Egypt. Afr Health Sci (2019) 19(4):2892–905. doi:10.4314/ahs.v19i4.11
53. Samek, L. Overall Human Mortality and Morbidity Due to Exposure to Air Pollution. Int J Occup Med Environ Health (2016) 29(3):417–26. doi:10.13075/ijomeh.1896.00560
54. Miri, M, Ebrahimi Aval, H, Ehrampoush, MH, Mohammadi, A, Toolabi, A, Nikonahad, A, et al. Human Health Impact Assessment of Exposure to Particulate Matter: An AirQ Software Modeling. Environ Sci Pollut Res Int (2017) 24(19):16513–9. doi:10.1007/s11356-017-9189-9
55. Ghozikali, MG, Borgini, A, Tittarelli, A, Amrane, A, Naddafi, K, Mohammadyan, M, et al. Quantification of the Health Effects of Exposure to Air Pollution (NO2) in Tabriz, Iran. Fresenius Environ Bull (2015) 24(11C):4142–8.
56. Dehghani, MH, Hopke, PK, Asghari, FB, Mohammadi, AA, and Yousefi, M. The Effect of the Decreasing Level of Urmia Lake on Particulate Matter Trends and Attributed Health Effects in Tabriz, Iran. Microchemical J (2020) 153:104434. doi:10.1016/j.microc.2019.104434
57. Moustris, KP, Ntourou, K, and Nastos, PT. Estimation of Particulate Matter Impact on Human Health Within the Urban Environment of Athens City, Greece. Urban Sci (2017) 1(1):6. doi:10.3390/urbansci1010006
58. Varol, G, Tokuc, B, Ozkaya, S, and Caglayan, C. Air Quality and Preventable Deaths in Tekirdag, Turkey. Air Qual Atmosphere Health (2021) 14(6):843–53. doi:10.1007/s11869-021-00983-2
59. Rovira, J, Domingo, JL, and Schuhmacher, M. Air Quality, Health Impacts and Burden of Disease due to air Pollution (PM10, PM2.5, NO2 and O-3): Application of AirQ Plus Model to the Camp de Tarragona County (Catalonia, Spain). Sci Total Environ (2020) 703:135538. doi:10.1016/j.scitotenv.2019.135538
60. Matkovic, V, Mulić, M, Azabagić, S, and Jevtić, M. Premature Adult Mortality and Years of Life Lost Attributed to Long-Term Exposure to Ambient Particulate Matter Pollution and Potential for Mitigating Adverse Health Effects in Tuzla and Lukavac, Bosnia and Herzegovina. Atmosphere (2020) 11(10):1107. doi:10.3390/atmos11101107
61. Hwang, SL, Lin, YC, Hsiao, KY, Lin, CM, and Chi, MC. Spatiotemporal Assessment of Mortality Attributable to Ambient PM2.5 Exposure in Taiwan During 2008-2015. Air Qual Atmosphere Health (2020) 13(2):233–45. doi:10.1007/s11869-019-00788-4
62. Todorović, MN, Radenković, MB, Rajšić, SF, and Ignjatović, LM. Evaluation of Mortality Attributed to Air Pollution in the Three Most Populated Cities in Serbia. Int J Environ Sci Tech (2019) 16(11):7059–70. doi:10.1007/s13762-019-02384-6
63. Sicard, P, Khaniabadi, YO, Perez, S, Gualtieri, M, and De Marco, A. Effect of O-3, PM10 and PM2.5 on Cardiovascular and Respiratory Diseases in Cities of France, Iran and Italy. Environ Sci Pollut Res (2019) 26(31):32645–65. doi:10.1007/s11356-019-06445-8
64. Hopke, PK, Nazari, SSH, Hadei, M, Yarahmadi, M, Kermani, M, Yarahmadi, E, et al. Spatial and Temporal Trends of Short-Term Health Impacts of PM2.5in Iranian Cities; A Modelling Approach (2013–2016). Aerosol Air Qual Res (2018) 18(2):497–504. doi:10.4209/aaqr.2017.09.0325
65. Yarahmadi, M, Hadei, M, Nazari, SSH, Conti, GO, Alipour, MR, Ferrante, M, et al. Mortality Assessment Attributed to Long-Term Exposure to Fine Particles in Ambient Air of the Megacity of Tehran, Iran. Environ Sci Pollut Res Int (2018) 25(14):14254–62. doi:10.1007/s11356-018-1680-4
66. Aliyu, YA, and Botai, JO. An Exposure Appraisal of Outdoor Air Pollution on the Respiratory Well-Being of a Developing City Population. J Epidemiol Glob Health (2018) 8(1):91–100. doi:10.2991/j.jegh.2018.04.002
67. De Marco, A, Amoatey, P, Khaniabadi, YO, Sicard, P, and Hopke, PK. Mortality and Morbidity for Cardiopulmonary Diseases Attributed to PM(2.5) Exposure in the Metropolis of Rome, Italy. Eur J Intern Med (2018) 57:49–57. doi:10.1016/j.ejim.2018.07.027
68. Hadei, M, Nazari, SSH, Yarahmadi, M, Kermani, M, Farhadi, M, and Shahsavani, A. Estimation of Gender-Specific Lung Cancer Deaths Due to Exposure to PM2.5 in 10 Cities of Iran During 2013 - 2016: A Modeling Approach. Int J Cancer Manag (2017) 10(8). doi:10.5812/ijcm.10235
69. Karimi, A, Shirmardi, M, Hadei, M, Birgani, YT, Neisi, A, Takdastan, A, et al. Concentrations and Health Effects of Short- and Long-Term Exposure to PM2.5, NO2, and O3 in Ambient Air of Ahvaz City, Iran (2014–2017). Ecotoxicology Environ Saf (2019) 180:542–8. doi:10.1016/j.ecoenv.2019.05.026
70. Goudarzi, G, Hopke, PK, and Yazdani, M. Forecasting PM2.5 Concentration Using Artificial Neural Network and its Health Effects in Ahvaz, Iran. Chemosphere (2021) 283:131285. doi:10.1016/j.chemosphere.2021.131285
71. Fallahizadeh, S. Quantification of Health Effects of Ambient PM10 in Gachsaran City, Iran, in Year 2015, Using the AirQ Software. Health Syst Res (2018) 14(1):73–8. doi:10.22122/jhsr.v14i1.3127
72. Moradi, M, Hadei, M, Yazdani, M, Goudarzi, M, Baboli, Z, Tahmasebi, B, et al. Effect of Long-Term Exposure to PM(2.5) on Years of Life Lost in a Populated Middle Eastern City. Environ Geochem Health (2021) 43(8):3229–35. doi:10.1007/s10653-021-00827-z
73. Moradi, M, Mokhtari, A, Mohammadi, MJ, Hadei, M, and Vosoughi, M. Estimation of Long-Term and Short-Term Health Effects Attributed to PM2.5 Standard Pollutants in the Air of Ardabil (Using Air Q + Model). Environ Sci Pollut Res (2022) 29(15):21508–16. doi:10.1007/s11356-021-17303-x
74. Hossaini Motlagh, A, Zarrabi, S, Rezaei, S, and Jamshidi, A. Investigation of Health Effects of Air Pollution in Yasuj, Iran, in 2016 Using AirQ+ Model. Armaghane Danesh (2022) 27(5):590–606. doi:10.52547/armaghanj.27.5.9
75. Vahidi, M, Fanaei, F, and Kermani, M. Long-Term Health Impact Assessment of PM2.5 and PM10 Karaj, Iran. Int J Environ Health Eng (2020) 9:8. doi:10.4103/ijehe.ijehe_16_20
76. Faridi, S, Shamsipour, M, Krzyzanowski, M, Künzli, N, Amini, H, Azimi, F, et al. Long-Term Trends and Health Impact of PM2.5 and O3 in Tehran, Iran, 2006–2015. Environ Int (2018) 114:37–49. doi:10.1016/j.envint.2018.02.026
77. Barrero, M, Orza, J, Cabello, M, and Cantón, L. Categorisation of Air Quality Monitoring Stations by Evaluation of PM10 Variability. Sci Total Environ (2015) 524:225–36. doi:10.1016/j.scitotenv.2015.03.138
78. Song, C, He, J, Wu, L, Jin, T, Chen, X, Li, R, et al. Health Burden Attributable to Ambient PM2. 5 in China. Environ Pollut (2017) 223:575–86. doi:10.1016/j.envpol.2017.01.060
79. Berglind, N, Bellander, T, Forastiere, F, von Klot, S, Aalto, P, Elosua, R, et al. Ambient Air Pollution and Daily Mortality Among Survivors of Myocardial Infarction. Epidemiology (2009) 20:110–8. doi:10.1097/EDE.0b013e3181878b50
80. Barzeghar, V, Sarbakhsh, P, Hassanvand, MS, Faridi, S, and Gholampour, A. Long-Term Trend of Ambient Air PM10, PM2.5, and O3 and Their Health Effects in Tabriz City, Iran, During 2006–2017. Sust Cities Soc (2020) 54:101988. doi:10.1016/j.scs.2019.101988
81. Naddafi, K, Hassanvand, MS, Yunesian, M, Momeniha, F, Nabizadeh, R, Faridi, S, et al. Health Impact Assessment of Air Pollution in Megacity of Tehran, Iran. Iranian J Environ Health Sci Eng (2012) 9(1):28–7. doi:10.1186/1735-2746-9-28
82. Miri, M, Alahabadi, A, Ehrampush, MH, Rad, A, Lotfi, MH, Sheikhha, MH, et al. Mortality and Morbidity Due to Exposure to Ambient Particulate Matter. Ecotoxicol Environ Saf (2018) 165:307–13. doi:10.1016/j.ecoenv.2018.09.012
83. Henschel, S, and Chan, G, World Health Organization. Regional Office for Europe Health Risks of Air Pollution in Europe: HRAPIE Project: New Emerging Risks to Health from Air Pollution: Results from the Survey of Experts. Copenhagen, Denmark: WHO Regional Office for Europe (2013).
84. Amoatey, P, Takdastan, A, Sicard, P, Hopke, PK, Baawain, M, Omidvarborna, H, et al. Short and Long-Term Impacts of Ambient Ozone on Health in Ahvaz, Iran. Hum Ecol Risk Assess (2019) 25(5):1336–51. doi:10.1080/10807039.2018.1492872
85. Manojkumar, N, and Srimuruganandam, B. Spatio-Temporal Health Benefits Attributable to PM(2.5) Reduction in an Indian City. Int J Environ Health Res (2022) 33:552–62. doi:10.1080/09603123.2022.2040959
86. Manojkumar, N, and Srimuruganandam, B. Spatio-Temporal Health Benefits Attributable to PM2. 5 Reduction in an Indian City. Int J Environ Health Res (2023) 33(6):552–62. doi:10.1080/09603123.2022.2040959
87. Egerstrom, N, Rojas-Rueda, D, Martuzzi, M, Jalaludin, B, Nieuwenhuijsen, M, So, R, et al. Health and Economic Benefits of Meeting WHO Air Quality Guidelines, Western Pacific Region. Bull World Health Organ (2023) 101(2):130–9. doi:10.2471/BLT.22.288938
88. Prabhu, V, Singh, P, Kulkarni, P, and Sreekanth, V. Characteristics and Health Risk Assessment of Fine Particulate Matter and Surface Ozone: Results From Bengaluru, India. Environ Monit Assess (2022) 194(3):211. doi:10.1007/s10661-022-09852-6
89. Balidemaj, F, Isaxon, C, Abera, A, and Malmqvist, E. Indoor Air Pollution Exposure of Women in Adama, Ethiopia, and Assessment of Disease Burden Attributable to Risk Factor. Int J Environ Res Public Health (2021) 18(18):9859. doi:10.3390/ijerph18189859
90. Li, Y, Zhao, XG, Liao, Q, Tao, Y, and Bai, Y. Specific Differences and Responses to Reductions for Premature Mortality Attributable to Ambient PM2.5 in China. Sci Total Environ (2020) 742:140643. doi:10.1016/j.scitotenv.2020.140643
91. Saeedi, R, Khani Jazani, R, Khaloo, SS, Amirkhani Ardeh, S, Fouladi-Fard, R, and Nikukalam, H. Risk Assessment of Occupational and Public Exposures to Airborne Particulate Matter Arising From a Subway Construction Site in Tehran, Iran. Air Qual Atmosphere Health (2021) 14(6):855–62. doi:10.1007/s11869-021-00984-1
92. Nasir, AH, Nawaz, R, Haider, R, and Irshad, MA. Modeling Air Pollution Health Risk for Environmental Management of an Internationally Important Site: The Salt Range (Kallar Kahar), Pakistan. Atmosphere (2022) 13(1):100. doi:10.3390/atmos13010100
93. Ansari, M, and Ehrampoush, MH. Meteorological Correlates and AirQ(+) Health Risk Assessment of Ambient Fine Particulate Matter in Tehran, Iran. Environ Res (2019) 170:141–50. doi:10.1016/j.envres.2018.11.046
94. Faridi, S, Niazi, S, Shamsipour, M, and Hassanvand, MS. Comments on:“Meteorological Correlates and AirQ+ Health Risk Assessment of Ambient Fine Particulate Matter in Tehran, Iran”. Environ Res (2019) 174:122–4. doi:10.1016/j.envres.2019.04.026
95. Al-Hemoud, A, Gasana, J, Al-Dabbous, AN, Al-Shatti, A, and Al-Khayat, A. Disability Adjusted Life Years (DALYs) in Terms of Years of Life Lost (YLL) Due to Premature Adult Mortalities and Postneonatal Infant Mortalities Attributed to PM(2.5) and PM(10) Exposures in Kuwait. Int J Environ Res Public Health (2018) 15(11):2609. doi:10.3390/ijerph15112609
96. Ebrahimi Ghadi, M, Qaderi, F, and Babanezhad, E. Prediction of Mortality Resulted From NO 2 Concentration in Tehran by Air Q+ Software and Artificial Neural Network. Int J Environ Sci Tech (2019) 16(3):1351–68. doi:10.1007/s13762-018-1818-4
97. Sacks, JD, Fann, N, Gumy, S, Kim, I, Ruggeri, G, and Mudu, P. Quantifying the Public Health Benefits of Reducing Air Pollution: Critically Assessing the Features and Capabilities of WHO's AirQ+ and U.S. EPA's Environmental Benefits Mapping and Analysis Program-Community Edition (BenMAP-CE). Atmosphere (2020) 11(5):1–15. doi:10.3390/atmos11050516
Keywords: AirQ, air pollution, burden of disease, health risk assessment, WHO
Citation: Amini H, Yousefian F, Faridi S, Andersen ZJ, Calas E, Castro A, Cervantes-Martínez K, Cole-Hunter T, Corso M, Dragic N, Evangelopoulos D, Gapp C, Hassanvand MS, Kim I, Le Tertre A, Medina S, Miller B, Montero S, Requia WJ, Riojas-Rodriguez H, Rojas-Rueda D, Samoli E, Texcalac-Sangrador JL, Yitshak-Sade M, Schwartz J, Kuenzli N, Spadaro JV, Krzyzanowski M and Mudu P (2024) Two Decades of Air Pollution Health Risk Assessment: Insights From the Use of WHO’s AirQ and AirQ+ Tools. Public Health Rev 45:1606969. doi: 10.3389/phrs.2024.1606969
Received: 13 December 2023; Accepted: 22 May 2024;
Published: 18 June 2024.
Edited by:
Ana Ribeiro, University Porto, PortugalReviewed by:
Zahra Khorrami, Shahid Beheshti University of Medical Sciences, IranGaige Kerr, George Washington University, United States
Tess Carter, Independent Researcher, Washington DC, United States
Copyright © 2024 Amini, Yousefian, Faridi, Andersen, Calas, Castro, Cervantes-Martínez, Cole-Hunter, Corso, Dragic, Evangelopoulos, Gapp, Hassanvand, Kim, Le Tertre, Medina, Miller, Montero, Requia, Riojas-Rodriguez, Rojas-Rueda, Samoli, Texcalac-Sangrador, Yitshak-Sade, Schwartz, Kuenzli, Spadaro, Krzyzanowski and Mudu. This is an open-access article distributed under the terms of the Creative Commons Attribution License (CC BY). The use, distribution or reproduction in other forums is permitted, provided the original author(s) and the copyright owner(s) are credited and that the original publication in this journal is cited, in accordance with accepted academic practice. No use, distribution or reproduction is permitted which does not comply with these terms.
PHR is edited by the Swiss School of Public Health (SSPH+) in a partnership with the Association of Schools of Public Health of the European Region (ASPHER)+
*Correspondence: Heresh Amini, aGVyZXNoLmFtaW5pQG1zc20uZWR1
†These authors share first authorship