- 1Clinical Research Ward, Clinical Research Center, Shanghai Children’s Medical Center, School of Medicine, Shanghai Jiao Tong University, Shanghai, China
- 2China Institute for Urban Governance, Shanghai Jiao Tong University, Shanghai, China
- 3Department of Endocrinology, Shanghai Children’s Medical Center, School of Medicine, Shanghai Jiao Tong University, Shanghai, China
- 4Department of Endocrinology, Ren Ji Hospital, Shanghai Jiao Tong University School of Medicine, Shanghai, China
- 5Department of Cardiology, Ren Ji Hospital, Shanghai Jiao Tong University School of Medicine, Shanghai, China
- 6Department of Pharmacy, Ren Ji Hospital, Shanghai Jiao Tong University School of Medicine, Shanghai, China
Objectives: To simulate the growth trend of diabetes mellitus in Chinese population.
Methods: The system dynamic modeling methodology was used to establish a population prediction model of diabetes with or without cardiovascular diseases. Lifestyle therapy and the use of metformin, acarbose, and voglibose were assumed to be intervention strategy. The outcomes will be examined at 5, 15, and 30 years after 2020.
Results: The projected number of diabetic population in China would increase rapidly from 141.65 million in 2020 to 202.84 million in 2050. Diabetic patients with cardiovascular disease would rapidly increase from 65.58 million in 2020 to 122.88 million by 2050. The annual cost for the entire population with diabetes mellitus in China would reach 182.55 billion by 2050. When the treatment of cardiovascular disease was considered, expenditure was 1.5–2.5-fold higher. Lifestyle therapy and the use of metformin, acarbose and voglibose could effectively slow the growth of the diabetic population.
Conclusion: The diabetic population in China is expected to increase rapidly, and diabetic patients with cardiovascular disease will increase greatly. Interventions could delay it.
Introduction
Diabetes mellitus (DM) is a complex chronic disease that requires continuous medical care [1]. China has the largest number of patients with DM globally, accounting for one in four all adults living with DM worldwide [2]. Over the recent decades, the prevalence of DM in China has increased from 1% in the 1980s to 5.5% in 2001, 9.7% in 2007, 11.6% in 2010, and 12.8% in 2017 [3, 4]. The extensive national survey indicated that the tota population with DM in mainland China is estimated to be 129.8 million in 2017 [4], and is expected to increase to 174.4 million by 2045 [5]. Owing to the rapid growth of the population with DM, the increasing cost of its prevention and control has increased the health burden [4]. It is estimated that the DM-related health expenditure in China will be US$ 165.3 billion in 2021 [5]. Accordingly, China will face a serious burden of diabetes prevention and control in the future.
Interventions can be advanced according to the prediction results only by accurately predicting the future situation. Scholars in the United States [6] and the Netherlands [7] have made several future projections of diabetes burden and total prevalence in their own countries. The International Diabetes Federation (IDF) Diabetes Atlas 10th edition provided country-level estimates on DM prevalence and health expenditures, which projected that the population with DM in China would reach over 174 million by 2045 [5]. However, some large epidemiological data [8, 9] and data from intervention studies [10, 11] in China were not included into their prediction model. To date, no prediction has focused on DM population and expenditure in China.
The prevention and treatment of diabetes and its complications is dynamic and complex [12]. Early and appropriate intervention can significantly affect the occurrence, development, and deterioration of DM and its complications [13]. Lifestyle therapy and drug therapy such as metformin [14], acarbose [15], and voglibose [16], can delay the progression of DM. However, the overall impact of these interventions on the future population with DM in China remains unknown. Simulation models are considered sensible choices for solving complex problems [17].
The system dynamics (SD) model, which combines social science and behavioral science, can simulate complex dynamic behavior over time via interlocking sets of differential and algebraic equations developed from an extensive spectrum of relevant empirical data [18]. The main features of SD simulation are a feedback loop, stocks and flow function, and time delay, and it can be carried out qualitatively or quantitatively [17]. It has been effectively used to address dynamically complex issues in healthcare [17, 19], health policy [20] and the management of chronic diseases [21, 22], including DM [7]. Currently, scholars from the United States and the Netherlands have reported the simulating results of population with DM by SD models [7, 23]. However, these models cannot be directly applied to the Chinese population. In the present study, we optimized an SD model of the journey of patients with diabetes to visualize and explore the consequences via different intervention scenarios. Meanwhile, we also introduced an important complication of DM, cardiovascular disease (CVD), into our SD model [24]. We hope to use SD models to simulate the control of different interventions on the DM population and health expenditures to provide a theoretical tool for future decision-makers to formulate intervention strategies.
Methods
The Model Structure
The current SD model was derived from the original diabetes model of the Center for Diabetes Control and Prevention in the USA [25] and recent research on the Dutch population [7]. The modeling methodology of SD was used to create simulation models for evaluating the impact of different prevention strategies on the DM population, diabetic patients with or without CVD, and the total health cost in China. A simplified causal loop diagram and its behavior, illustrating stocks and flows, are shown in Figure 1. A population model and its behavior illustrate stocks and flows, in which numbers of people in different states are called “stocks” (e.g., DM population, prediabetes population), and the numbers transitioning between the states are called “flows” (e.g., undiagnosed prediabetes to DM, diagnosed prediabetes to DM). The variables are indicated by words preceding single arrows, adding detailed information between stocks and flows. Arrows and plus signs indicate positive effects, whereas arrows with negative signs show negative effects.
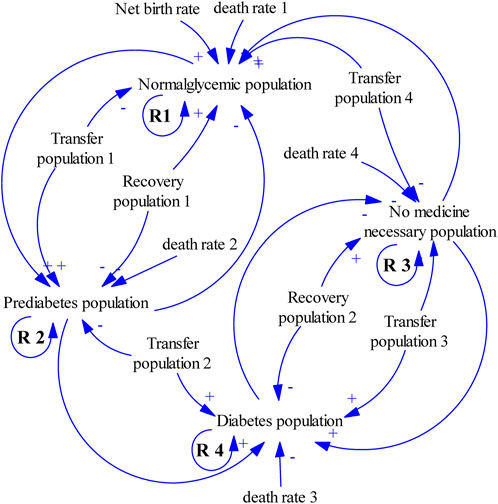
FIGURE 1. Simple casual loop diagram. (System dynamic model simulates the growth trend of diabetes mellitus, China. 2020–2050). The four stocks are the normoglycemic, prediabetes, no necessary medicine, and diabetes populations. People with normal blood glucose and those who do not need medication will develop prediabetes, and then diabetes. Few people with diabetes will return to a state that does not require drugs, and some people with prediabetes will return to standard blood glucose levels. The higher the baseline population in the four states, the higher the number of people, and a reinforcing loop (R1 to R4) is presented. Arrows and plus signs indicate positive effects, whereas arrows with negative signs show negative effects.
The model consists of two linked sub-models: the DM model (Model 1) and the combined CVD model (Model 2). Both models are used to estimate the progress of DM population and the effect of different interventions on the progress of DM population. The models presented herein were developed and modified in four stages: 1) participatory systems mapping and conceptual diagram development based on prior diabetes models and expert consensus [7, 25]; 2) converting the conceptual diagram into a computational model via parameterization with numeric inputs (mainly data from Chinese studies); 3) design, integrate, test, and optimize the strategies; and 4) model validation and intervention studies. The specific method for model establishment can be found in previous studies [7, 25]. Compared with previous studies, we do not distinguish between types of diabetes, but we differentiated the DM population combined with CVD [7, 25].
The DM model was used to project the growth trend of DM population in China. The model structure settings are shown in Figure 2. We assumed that the population related to DM was divided into three categories: normoglycemic, prediabetes, and DM populations. The state of the normoglycemic population was defined as fasting blood glucose <6.1 mmol/L and 2-hour postprandial blood glucose <7.8 mmol/L. Prediabetes population were individuals with fasting blood glucose between 6.1 and 7.0 mmol/L (impaired fasting glucose, IFG), or 2-hour postprandial blood glucose between 7.8 and 11.1 mmol/L (impaired glucose tolerance, IGT), or both conditions are satisfied. Likewise, the DM population referred to individuals with fasting blood glucose >7.0 mmol/L or 2-hour postprandial or random blood glucose >11.1 mmol/L [26]. DM population leaves the DM stocks in two ways: either they die due to DM when reaching the average age of DM patients, or by recovering from DM.
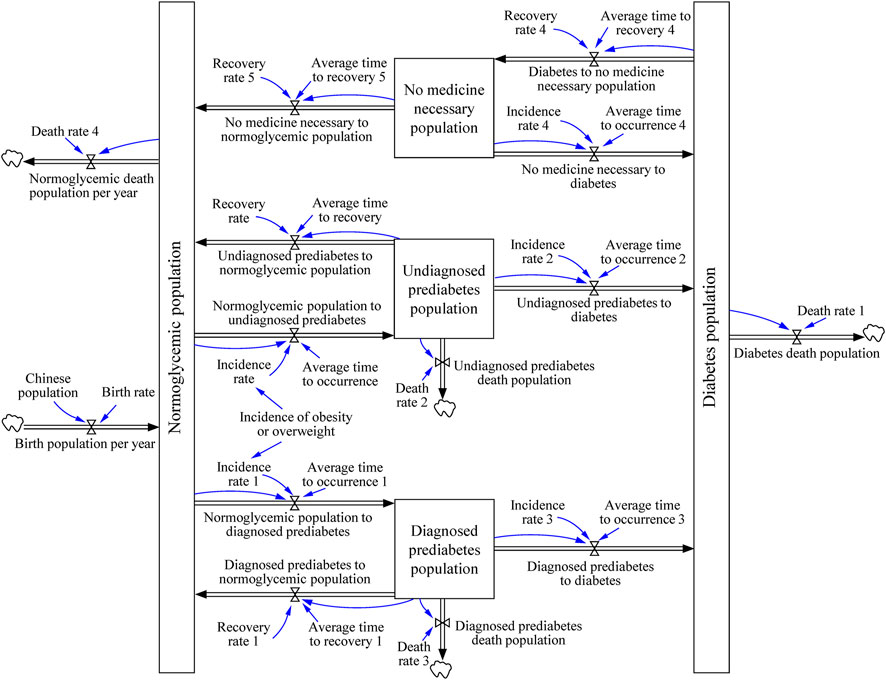
FIGURE 2. The journey of patient with diabetes. (System dynamic model simulates the growth trend of diabetes mellitus, China. 2020–2050). Boxes are stocks that accumulate over time, and double arrows are in- or outflows that either provide input or take the output of stocks. The blue arrows indicate the links between cause and effect. Clouds are outputs that “flow out of the system” like death. The system contains the differential equations described in the “Building the DM Model” section.
In Model 2, we introduced CVD, the most noticeable complication of DM. The difference between the two models was that in Model 2 the diabetic population was divided into two categories: DM with or without CVD (Figure 3). DM is associated with a higher risk of CVD [27, 28]. In this study, we hypothesis that diabetes occurs first and then CVD. Indeed, people with CVD could also later develop type 2 diabetes, especially considering many similar risk factors are shared by these two diseases [27]. As we only obtain the epidemiological data of CVD in diabetes patients. Therefore in this study, we only included the population who developed CVD after DM but not those who developed CVD before DM.
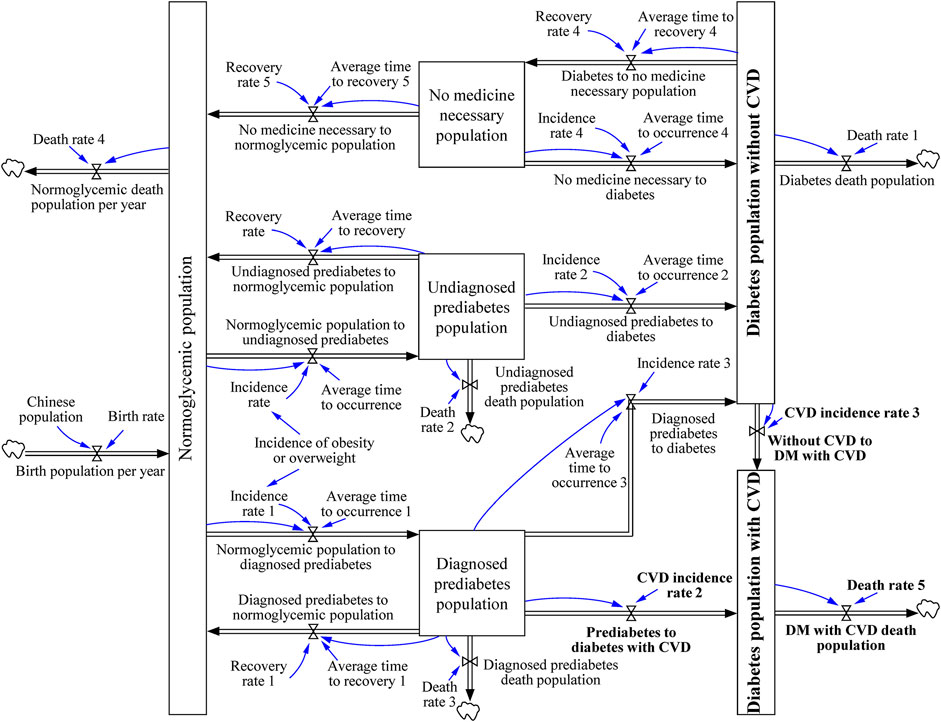
FIGURE 3. The journey of diabetic patient with cardiovascular disease. (System dynamic model simulates the growth trend of diabetes mellitus, China. 2020–2050). The journey was modified from “the journey of patient with diabetes,” which divided the population with diabetes into diabetic population without cardiovascular disease and diabetic population with cardiovascular disease. The system contains the differential equations described in the “Building the DM combined CVD Model” section.
Interventions and Scenarios
Lifestyle therapy and the use of metformin and acarbose are the main strategies recommended for the prevention of prediabetes by the American Association of Clinical Endocrinologists and American College of Endocrinology [29]. Considering the cardiovascular risk benefits of α-glucosidase inhibitors, we introduced another α-glucosidase inhibitor, voglibose, into our models to predict its effect on DM control. The four strategies and detailed parameter values used are listed in Table 1. Finally, five scenarios, including no intervention, lifestyle therapy and the use of metformin, acarbose, and voglibose were substituted into the models for simulation.
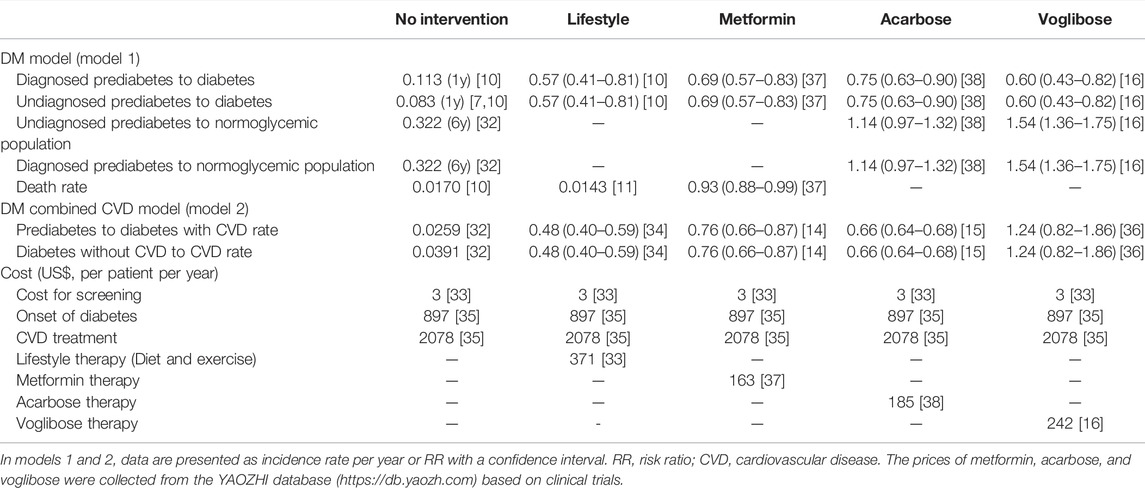
TABLE 1. Different intervention scenarios and their parameter values used in scenario simulation (Parameter values were obtained from Chinese census data, Epidemiological data, Da Qing Diabetes Prevention study, and several studies on health economics, China, and other countries. 1980–2019).
Parameter Setting
The demographic dataset used as the baseline Chinese population was obtained from the Chinese census data (National Bureau of Statistics). Epidemiological data on diabetes in China were obtained mainly from four large epidemiological surveys conducted in 2007 [8], 2010 [30], 2013 [31], and 2017 [4]. The conversion rates from prediabetes to DM and from DM to CVD were collected from the Da Qing Diabetes Prevention study [10, 11, 32]. The cost of DM expenditure, which includes DM prevention and treatment, was obtained from a societal perspective [33]. The cost for DM patients with CVD included the expenditure on CVD prevention and treatment [34, 35]. The cost of lifestyle interventions was based on a published modeling study [33]. The cost of drug intervention strategies was mainly calculated from the price of each drug (YaoZhi database, https://db.yaozh.com/) and the drug dosage in the intervention programs (metformin, acarbose, or voglibose) [16, 33, 36–38]. A schematic overview of the total cost of diabetes using dynamic simulations is shown in Supplementary Figure S1. The input values for the models used in this study are presented in Supplementary Tables S1–S3.
Outcomes
DM population, DM population with or without CVD, and total cost of DM were used as the outcomes of this study. The time horizon of the model was 30 years from intervention implementation, based on proposals of party leadership for formulating the 14th Five-Year Plan for National Economic and Social Development and the Long-Range Objectives, through the year 2035. The outcomes were examined at 5, 15, and 30 years.
Validation of the Model
The representations of the model equations underwent repeated checks with the modelling alliance for structural verification. The data and equations for these models are presented in Supplementary Tables S1, S2. To validate the model, the initial value of the variables was set to 2007, which was simulated in the next 10 years (2007–2017). Key predicted DM population outcomes were used for calibration against administrative data recorded in published diabetes epidemiology studies in 2007 [8], 2010 [30], 2013 [31] and 2017 [4]. To parameterize the model, data were verified against published evidence and data, or consensus within the modeling alliance in the absence of directly relevant data. A stock-flow diagram was established using the Vensim PLE software package (7.3.5) based on the system boundaries, inputs, outputs, and auxiliary variables.
Results
Model Validation
The validation results are presented in Table 2. The behavior reproduction test examined the ability of model to replicate the reference behavior model on published data on the DM population from 2007 to 2017. The mean absolute percentage error (MAPE) ranged from 1.22 to 5.47 (average, 2.33) and 0.77–5.77 (average, 2.17) in the DM and DM combined CVD models, respectively, which is a reasonable range. Thus, the model is considered valid and reasonable.
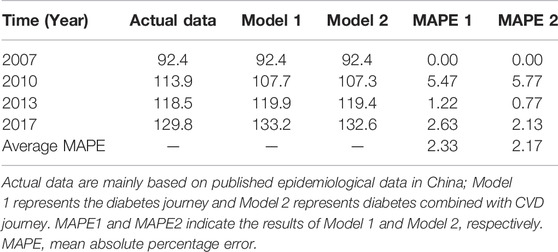
TABLE 2. Validation analysis of the model on population with diabetes (Million) (System dynamic model simulates the growth trend of diabetes mellitus, China. 2007–2017).
Projections of DM Population
The projections of the number of patients with DM and DM with or without CVD from 2020 to 2050 are presented in Table 3. In both Model 1 (the DM model) and Model 2 (the DM with CVD model), the prediction results indicated that the DM population would increase rapidly, and the prediction results of the two models remained consistent. CVD variables were introduced in Model 2. The results indicated that the growth of DM patients without CVD would be slow, but the growth of DM patients with CVD would be rapid. These data indicate that by 2050, the number of patients with DM in the Chinese population will increase rapidly, and the growth rate of patients with DM and CVD will accelerate. CVD would become the main complication of diabetes.
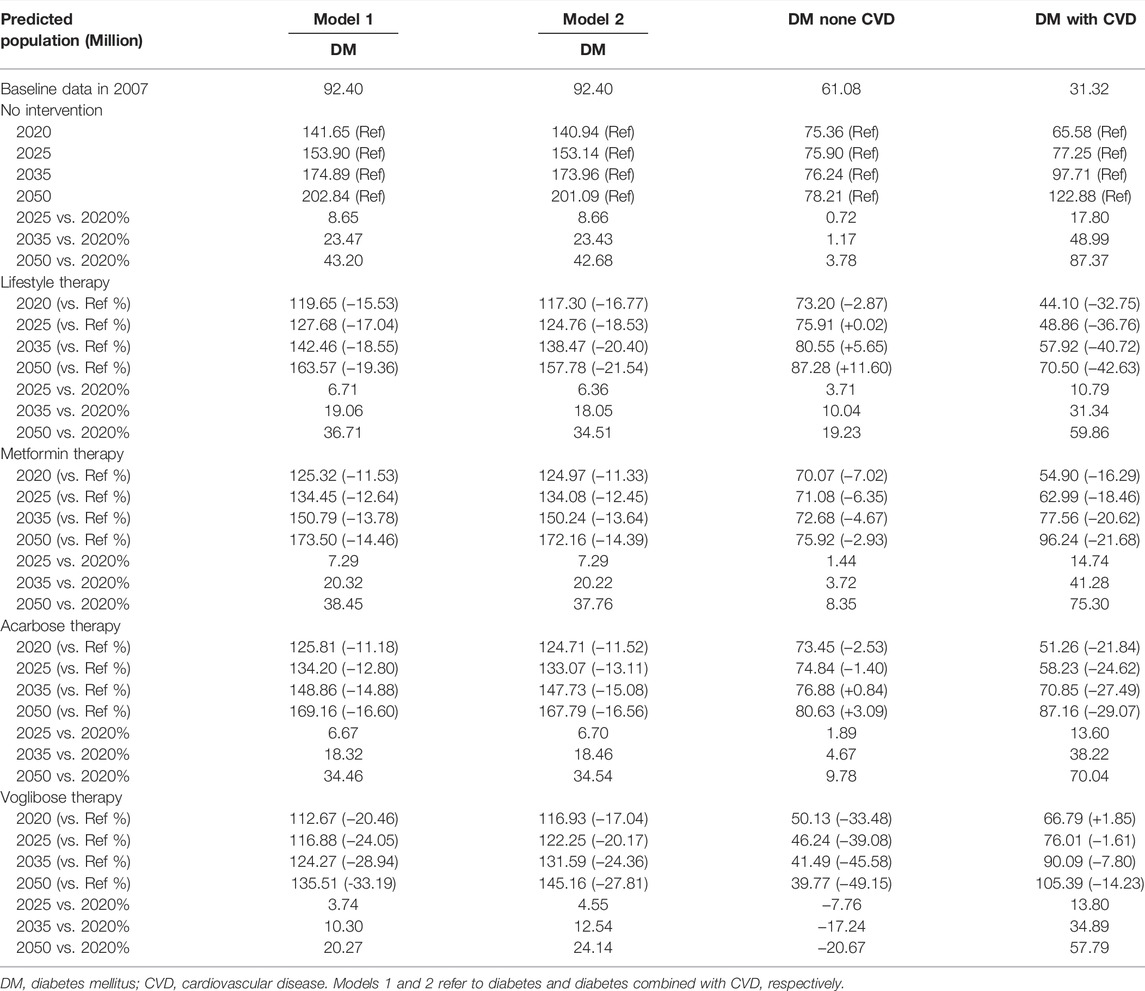
TABLE 3. Simulated values of population with diabetes in different scenario from 2020 to 2050 (System dynamic model simulates the growth trend of diabetes mellitus, China. 2020–2050).
When four intervention scenarios, namely, were lifestyle intervention and the use of metformin, acarbose, and voglibose, were introduced into both Model 1 and Model 2, the predicted number of DM population decreased (Table 3). All four interventions can reduce the number of DM population with CVD.
Projections of DM Intervention Cost
The simulation results for the impact of the intervention on the total cost of diabetes are presented in Table 4. The results from Model 1 indicated that by 2050, compared with 2020, the annual cost for the entire DM population in China would increase by 43.19%, and the total cost would reach 182.55 billion. In Model 1, lifestyle intervention and the use of metformin and acarbose would increase the annual cost for the entire DM population. However, the use of voglibose would decrease the annual cost. These results indicated that the use of voglibose could reduce the overall treatment burden of the DM population. In Model 2, when CVD was introduced, the overall cost of the DM population increased significantly, which was mainly due to the increased cost of CVD prevention and treatment. Lifestyle intervention and the use of metformin and acarbose would increase the annual cost for the DM population without CVD but could reduce the overall cost of the DM population. Interestingly, all four interventions could reduce the cost of the DM population with CVD.
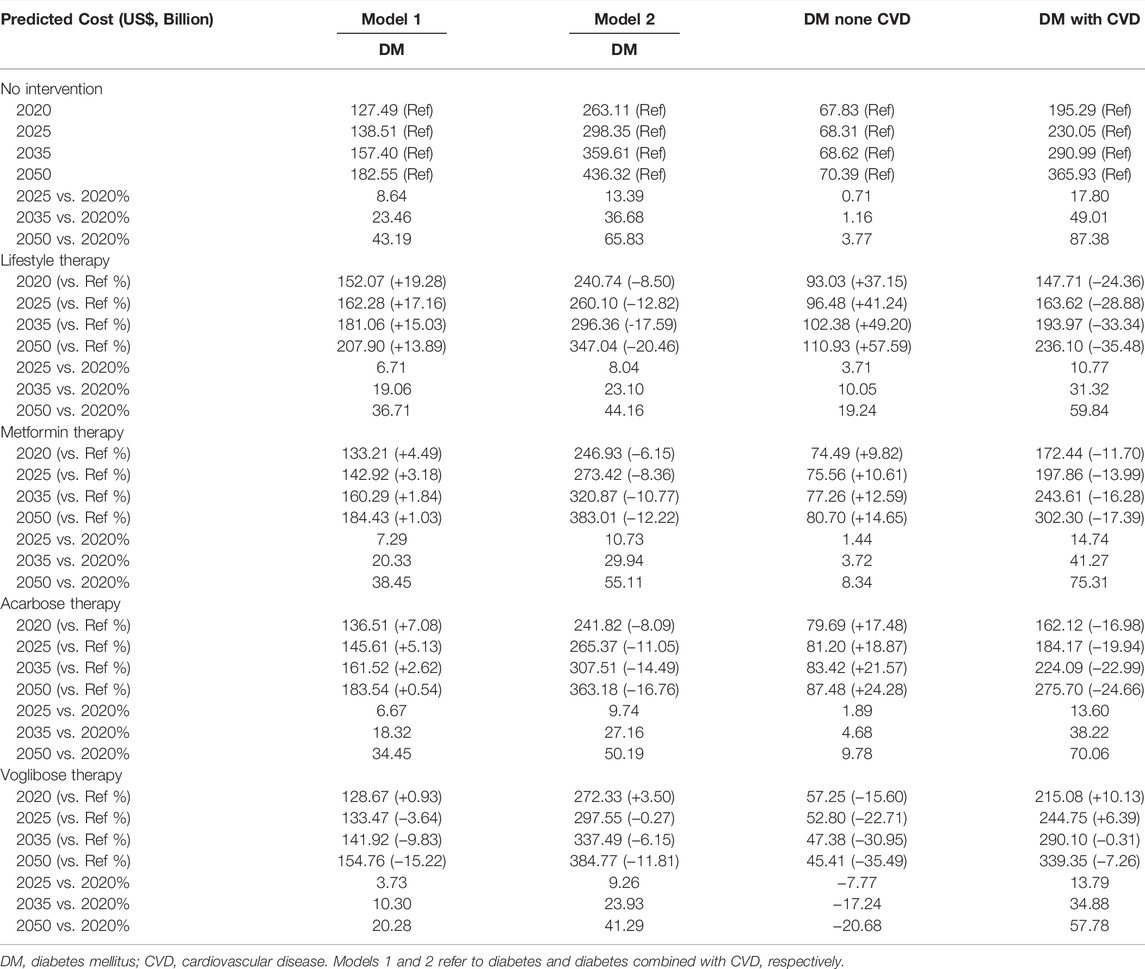
TABLE 4. Simulated values of cost in different scenario from 2020 to 2050 (System dynamic model simulates the growth trend of diabetes mellitus, China. 2020–2050).
Discussion
“Joint construction, sharing and health for all” is the strategic theme of building a healthy China. China is a vast country, and the health strategy is formulated by the country. In 2016, China issued the outline of the “healthy China 2030” plan and listed the full coverage of management interventions for patients with diabetes. Due to the lack of prediction models for future development trends in the DM population in China, it remains still unclear how to formulate future prevention and treatment strategies for DM in China. Establishing SD model is a way to solve this problem. Jones AP et al. [23] developed a SD model to explain the growth of diabetes since 1980 through 2050 in the United States. Three policy intervention scenarios, which were enhanced clinical management of diabetes, increased management of prediabetes, and reduced obesity prevalence, were evaluated [23]. Edwards RA et al. [39] reported a comprehensive causal simulator by using SD methodology to identify leverage points among diabetes interventions in the US. Sluijs T et al. [7] used the SD modeling methodology to develop a simulation model about the patient journey of type 2 DM and to assess the impact of lifestyle intervention programs on total cost for society in the Netherlands. Freebairn L et al. [40] developed dynamic simulation models to explore the impact of maternal weight status interventions on incidence of hyperglycemia in pregnancy. Ansah JP et al. [22] developed a SD model to evaluate the impact of hypertension, diabetes and smoking cessation management on CVD outcomes. Sugiyama T et al. [41] developed a SD model to predict the number of people with diabetes and initiation of dialysis due to diabetic nephropathy in Japan. The hypothetical interventions in their study were glycemic control, blood pressure control, and protein and salt reduction [41]. Guariguata L et al. [42] developed a diabetes SD model for guiding policy on diabetes in the Caribbean. Compared with these studies, we did not distinguish the type of diabetes, and the study population in our study included both type 1 diabetes and type 2 diabetes. This is mainly because the four diabetes epidemiological data in China included in our study did not distinguish the type of diabetes. In addition, CVD complications were added to our Model 2, which was not involved in previous study. In this study, we developed two DM prevention and control models to predict the number of people with DM and the economic burden of controlling DM. The results of both models suggest that the DM population in China will increase significantly by 2050. Diabetes-related health expenditures in China are projected to reach 182.55 billion USD by 2050. When CVD treatment was considered, the expenditure was 1.5–2.5-fold higher. Therefore, establishing a prediction model or DM in the Chinese population is important for predicting health intervention needs and planning public health plans.
To date, only two studies have addressed the projection of patients with DM in China. The IDF Diabetes Atlas 10th edition estimates that in 2021, 140.9 million people will be living with diabetes in China, which will increase to 174.4 million by 2045 [5]. However, their study did not include large national survey data in China when predicting the DM population and did not predicted for the year 2050. A recent Chinese study used the autoregressive integrated moving average (ARIMA) model to estimate the DM population and its economic burden from 2020 to 2025 [43]. This model predicted that by 2025, the DM population in China would be approximately 100 million and the financial burden of diabetes would be nearly 170 billion. However, the large national survey indicated that the total number of patients with diabetes in China was estimated to be 113.9 million in 2010 and 129.8 million in 2017 [4, 30]. The above ARIMA model only assessed a relatively short time horizon prediction, and the projection of the DM population was far from the published prevalence studies. Our study not only included the main national survey data but also extended the simulation time horizon from 2020 to 2050. In addition, we used the SD method to construct two sub-models of the diabetes journey, diabetes journey and diabetes with CVD journey. Notably, this study improved our understanding of the characteristic dynamics of the simulated DM population in China.
In this study, we predicted from Model 1 that by 2025, the DM population in China would be 153.90 million, which is higher than the 100 million estimated in a previous study [43]. We also predicted that by 2035, 174.89 million people in China would be diabetic, 10 years ahead of the previous study, which predicted that there would be 174.4 million diabetic people in 2045 [5]. The differences between our estimates and those of previous studies could be attributed to several factors. First, our initial population with diabetes, which was derived from national survey data, was higher than that predicted by previous studies. However, the initial predicted population with diabetes in 2007 was 92.4 million according to a national survey from 14 provinces and municipalities, which was used to simulate our study [8]. Second, we used four national surveys conducted between 2007 and 2017 to validate the results, and the model was considered valid and reasonable [4, 8, 30, 31]. In addition, we adopted SD to simulate our model, which can simulate nonlinear relationships between components of the systems, resulting in behaviors such as feedback loops and long delays between cause and effect, and the behaviors can change dynamically.
The State Council of China endorsed an important document as a response to disease epidemics, the Medium-to Long-term Plan for the Prevention and Treatment of Chronic Diseases (2017–2025), which aimed to decrease the mortality rate of CVD by 15% by 2025 compared with 2015 in China [44]. The CAPTRU study estimated that the prevalence of CVD in patients with diabetes in China was 33.9% [45]. CVD is the leading cause of diabetes-related morbidity and mortality. The glycated hemoglobin level is reduced by 0.9%, and major cardiovascular events can be reduced by 33% [46]. In Model 2, the predicted total DM population was consistent with that of Model 1. However, we estimated that there would a rapid growth in the number of diabetic patients with CVD from 2020 to 2050, and the predicted DM population would be 122.88 million in 2050. Therefore, the prevention and treatment of diabetes play an important role in reducing the incidence of cardiovascular complications.
Lifestyle therapy and the use of metformin and acarbose are the main strategies for the prevention of prediabetes [29]. In a cross-sectional study of type 2 diabetes, more than 50% patients had at least one chronic diabetes complication, with a prevalence of cardiovascular and cerebrovascular complications of 30.1% and 6.8%, respectively [47]. As α-glucosidase inhibitors confer a cardiovascular risk benefit, we introduced another α-glucosidase inhibitor, voglibose, into this model and predicted its effect on controlling DM [16]. After using the four scenarios for model simulation, the results indicated that by 2050, the overall DM population and DM patients with CVD would be significantly reduced. The prediction results showed that lifestyle therapy and the use of voglibose were associated with a remarkable decrease in the total number of patients with DM. However, only the use of metformin and voglibose can reduce the DM population without CVD in Model 2. In the two scenarios of lifestyle therapy and the use of acarbose, the prediction of DM population without CVD will still increase. This result can be attributed to the characteristics of the study population in the included studies. The role of lifestyle therapy and the use of acarbose in preventing diabetes with CVD is clear [1]. These studies about the lifestyle therapy and the use of acarbose included in our models were also concentrated in the population with DM combined with CVD. Therefore, in model 2, these two scenarios have little impact on the DM population without CVD.
The rapid growth of the DM population is accompanied by an increase in the economic burden. In our study, when the cost of CVD treatment was not considered, the predicted annual economic burden for the entire DM population in China was 182.55 billion by 2050. As many patients with DM have complications, the results from Model 1 may underestimate the real economic burden of the DM population. When considering CVD, the annual economic burden for the entire DM population was predicted to be 436.32 billion by 2050. The expenditure simulated by Model 2 was 1.5–2.5-fold higher than that of Model 1 in each scenario. These results suggest that, in the process of diabetes intervention, interventions should be fully considered for patients with CVD.
Based on the results of this study, we make the following public health and policy recommendations for policymakers: First, population with DM in China is predicted to grow rapidly, and active measures should be taken to intervene in the progress of this population. Lifestyle therapy and drug intervention maybe effectively slow the growth of the population with DM in China. In the future, China should strengthen the guidance and science popularization of the healthy lifestyle of people with DM and people at risk of DM, and actively promote lifestyle therapy and drug intervention. Second, China will face severe challenges of DM combined with CVD in the future. Our results predict that lifestyle therapy and drug intervention can effectively slow the growth and economic burden of people with DM combined with CVD. At present, acarbose is the only α-glycosidase inhibitor among the national essential drugs. It is recommended that voglibose be included in national essential drugs. Third, the government should strengthen the scientific prediction of the growth of the DM population in China and pay more attention to DM combined diseases, establish a more comprehensive SD model around DM and its combined diseases, and multiple treatment and intervention measures of DM, study and judge DM prevention and treatment situation and future development trend in China, and issue relevant policies in a timely manner.
Strengths and Limitations
The main strength of this study is that we combined recent national survey data to project the total population with diabetes using SD models.
However, our model has several limitations. First, although a national survey and large prevention studies were used, some data estimates and assumptions were made due to limited data. Second, no distinction in age groups was made, because specific data for all other variables per age group were scarce. Third, China is a vast country, but we did not study rural/urban differences. Furthermore, we only included CVD among the combined diseases of DM and did not include other diseases such as obesity. Finally, only four interventions were included in our models, and other strategies, such as the use of new hypoglycemic drugs, including sodium-dependent glucose transporter 2 inhibitors, were not included in this study.
Conclusion
Our study shows that the SD model can be used to predict the number of DM population in China. The projection of the DM population rapidly increases from 2020 to 2050, and this situation is serious. Lifestyle therapy and the use of hypoglycemic drugs, such as metformin and acarbose, could delay the growth of the DM population and reduce the economic burden. Our models predicted that voglibose would also have a postitve effect on controlling the growth of the DM population.
Data Availability Statement
The data supporting the findings of this study are available upon reasonable request from the corresponding authors.
Author Contributions
F-HS, H-WL, and Z-CG are the guarantors of the manuscript. HL, G-YC, and Y-HJ contributed to study conception and design, critical revision of the manuscript for important intellectual content, and final approval of the version to be published. LS, LX, and Y-HJ contributed to data acquisition, analysis, and interpretation.
Funding
This study is supported by the National Natural Science Foundation of China (81900722), Research Funds of Shanghai Health and Family Planning commission (20204Y0011, 20204Y0339), Shanghai Hospital Development Center Foundation (SHDC12022626, SHDC2022CRS052), Clinical Research Innovation and Cultivation Fund of Ren Ji hospital (RJPY-LX-008), Ren Ji Boost Project of National Natural Science Foundation of China (RJTJ-JX-001), the pharmaceutical fund of college of medicine, “Shanghai Jiao Tong University” (JDYX2017QN003), and Shanghai “Rising Stars of Medical Talent” Youth Development Program-Youth Medical Talents-Clinical Pharmacist Program (SHWJRS (2019) _072; SHWRS (2020) _087; SHWRS (2021) _099).
Conflict of Interest
The authors declare that the research was conducted in the absence of any commercial or financial relationships that could be construed as a potential conflict of interest.
Supplementary Material
The Supplementary Material for this article can be found online at: https://www.ssph-journal.org/articles/10.3389/ijph.2022.1605064/full#supplementary-material
References
1.American Diabetes Association. Introduction: Standards of Medical Care in Diabetes-2022. Diabetes Care (2022) 45:S1–s2. doi:10.2337/dc22-Sint
2. Sun, H, Saeedi, P, Karuranga, S, Pinkepank, M, Ogurtsova, K, Duncan, BB, et al. Diabetes Research and Clinical Practice (2021). p. 109119. doi:10.1016/j.diabres.2021.109119IDF Diabetes Atlas: Global, Regional and Country-Level Diabetes Prevalence Estimates for 2021 and Projections for 2045
3. Ma, RCW, Lin, X, and Jia, W. Causes of Type 2 Diabetes in China. Lancet Diabetes Endocrinol (2014) 2:980–91. doi:10.1016/S2213-8587(14)70145-7
4. Li, Y, Teng, D, Shi, X, Qin, G, Qin, Y, Quan, H, et al. Prevalence of Diabetes Recorded in mainland China Using 2018 Diagnostic Criteria from the American Diabetes Association: National Cross Sectional Study. BMJ (Clinical research ed) (2020) 369:m997. doi:10.1136/bmj.m997
5. Sun, H, Saeedi, P, Karuranga, S, Pinkepank, M, Ogurtsova, K, Duncan, BB, et al. IDF Diabetes Atlas: Global, Regional and Country-Level Diabetes Prevalence Estimates for 2021 and Projections for 2045. Diabetes Res Clin Pract (2022) 183:109119. doi:10.1016/j.diabres.2021.109119
6. Boyle, JP, Honeycutt, AA, Narayan, KM, Hoerger, TJ, Geiss, LS, Chen, H, et al. Projection of Diabetes burden through 2050: Impact of Changing Demography and Disease Prevalence in the U.S. Diabetes Care (2001) 24:1936–40. doi:10.2337/diacare.24.11.1936
7. Sluijs, T, Lokkers, L, Özsezen, S, Veldhuis, GA, and Wortelboer, HM. An Innovative Approach for Decision-Making on Designing Lifestyle Programs to Reduce Type 2 Diabetes on Dutch Population Level Using Dynamic Simulations. Front Public Health (2021) 9:652694. doi:10.3389/fpubh.2021.652694
8. Yang, W, Lu, J, Weng, J, Jia, W, Ji, L, Xiao, J, et al. Prevalence of Diabetes Among Men and Women in China. N Engl J Med (2010) 362:1090–101. doi:10.1056/NEJMoa0908292
9. Yang, Z, Xing, X, Xiao, J, Lu, J, Weng, J, Jia, W, et al. Prevalence of Cardiovascular Disease and Risk Factors in the Chinese Population with Impaired Glucose Regulation: the 2007-2008 China National Diabetes and Metabolic Disorders Study. Exp Clin Endocrinol Diabetes (2013) 121:372–4. doi:10.1055/s-0033-1341520
10. Li, G, Zhang, P, Wang, J, Gregg, EW, Yang, W, Gong, Q, et al. The Long-Term Effect of Lifestyle Interventions to Prevent Diabetes in the China Da Qing Diabetes Prevention Study: a 20-year Follow-Up Study. Lancet (2008) 371:1783–9. doi:10.1016/s0140-6736(08)60766-7
11. Li, G, Zhang, P, Wang, J, An, Y, Gong, Q, Gregg, EW, et al. Cardiovascular Mortality, All-Cause Mortality, and Diabetes Incidence after Lifestyle Intervention for People with Impaired Glucose Tolerance in the Da Qing Diabetes Prevention Study: a 23-year Follow-Up Study. Lancet Diabetes Endocrinol (2014) 2:474–80. doi:10.1016/s2213-8587(14)70057-9
12. Weisman, A, Fazli, GS, Johns, A, and Booth, GL. Evolving Trends in the Epidemiology, Risk Factors, and Prevention of Type 2 Diabetes: A Review. Can J Cardiol (2018) 34:552–64. doi:10.1016/j.cjca.2018.03.002
13. Brannick, B, and Dagogo-Jack, S. Prediabetes and Cardiovascular Disease: Pathophysiology and Interventions for Prevention and Risk Reduction. Endocrinol Metab Clin North Am (2018) 47:33–50. doi:10.1016/j.ecl.2017.10.001
14. Campbell, JM, Bellman, SM, Stephenson, MD, and Lisy, K. Metformin Reduces All-Cause Mortality and Diseases of Ageing Independent of its Effect on Diabetes Control: A Systematic Review and Meta-Analysis. Ageing Res Rev (2017) 40:31–44. doi:10.1016/j.arr.2017.08.003
15. Chen, JM, Chang, CW, Lin, YC, Horng, JT, and Sheu, WH. Acarbose Treatment and the Risk of Cardiovascular Disease in Type 2 Diabetic Patients: a Nationwide Seven-Year Follow-Up Study. J Diabetes Res (2014) 2014:812628. doi:10.1155/2014/812628
16. Kawamori, R, Tajima, N, Iwamoto, Y, Kashiwagi, A, Shimamoto, K, Kaku, K, et al. Voglibose for Prevention of Type 2 Diabetes Mellitus: a Randomised, Double-Blind Trial in Japanese Individuals with Impaired Glucose Tolerance. Lancet (2009) 373:1607–14. doi:10.1016/s0140-6736(09)60222-1
17. Davahli, MR, Karwowski, W, and Taiar, R. A System Dynamics Simulation Applied to Healthcare: A Systematic Review. Int J Environ Res Public Health (2020) 17:E5741. doi:10.3390/ijerph17165741
18. Nishi, N, Ikeda, N, Sugiyama, T, Kurotani, K, and Miyachi, M. Simulating the Impact of Long-Term Care Prevention Among Older Japanese People on Healthcare Costs from 2020 to 2040 Using System Dynamics Modeling. Front Public Health (2020) 8:592471. doi:10.3389/fpubh.2020.592471
19. Li, M, Yu, W, Tian, W, Ge, Y, Liu, Y, Ding, T, et al. System Dynamics Modeling of Public Health Services provided by China CDC to Control Infectious and Endemic Diseases in China. Infect Drug Resist (2019) 12:613–25. doi:10.2147/idr.S185177
20. Currie, DJ, Smith, C, and Jagals, P. The Application of System Dynamics Modelling to Environmental Health Decision-Making and Policy - a Scoping Review. BMC public health (2018) 18:402. doi:10.1186/s12889-018-5318-8
21. Peng, CQ, Lawson, KD, Heffernan, M, McDonnell, G, Liew, D, Lybrand, S, et al. Gazing through Time and beyond the Health Sector: Insights from a System Dynamics Model of Cardiovascular Disease in Australia. PloS one (2021) 16:e0257760. doi:10.1371/journal.pone.0257760
22. Ansah, JP, Inn, RLH, and Ahmad, S. An Evaluation of the Impact of Aggressive Hypertension, Diabetes and Smoking Cessation Management on CVD Outcomes at the Population Level: a Dynamic Simulation Analysis. BMC public health (2019) 19:1105. doi:10.1186/s12889-019-7429-2
23. Jones, AP, Homer, JB, Murphy, DL, Essien, JD, Milstein, B, and Seville, DA. Understanding Diabetes Population Dynamics through Simulation Modeling and Experimentation. Am J Public Health (2006) 96:488–94. doi:10.2105/ajph.2005.063529
24. Brown, AJM, Gandy, S, McCrimmon, R, Houston, JG, Struthers, AD, and Lang, CC. A Randomized Controlled Trial of Dapagliflozin on Left Ventricular Hypertrophy in People with Type Two Diabetes: the DAPA-LVH Trial. Eur Heart J (2020) 41:3421–32. doi:10.1093/eurheartj/ehaa419
25. Homer, J, Jones, A, Seville, D, Essien, J, Milstein, B, and Murphy, D The CDC's Diabetes Systems Modeling Project: Developing a New Tool for Chronic Disease Prevention and Control. In, 2005.
26. Society, CD. Guideline for the Prevention and Treatment of Type 2 Diabetes Mellitus in China. Clin J Diabetes Mellitus (2021) 13:315–409.
27. Schmidt, AM. Diabetes Mellitus and Cardiovascular Disease. Arterioscler Thromb Vasc Biol (2019) 39:558–68. doi:10.1161/ATVBAHA.119.310961
28.Hypoglycaemia. Cardiovascular Disease, and Mortality in Diabetes: Epidemiology, Pathogenesis, and Management. Lancet Diabetes Endocrinol (2019) 7:385–96. doi:10.1016/S2213-8587(18)30315-2
29. Garber, AJ, Abrahamson, MJ, Barzilay, JI, Blonde, L, Bloomgarden, ZT, Bush, MA, et al. Consensus Statement by the American Association of Clinical Endocrinologists and American College of Endocrinology on the Comprehensive TYPE 2 Diabetes Management Algorithm −2019 Executive Summary. Endocr Pract (2019) 25:69–100. doi:10.4158/CS-2018-0535
30. Xu, Y, Wang, L, He, J, Bi, Y, Li, M, Wang, T, et al. Prevalence and Control of Diabetes in Chinese Adults. Jama (2013) 310:948–59. doi:10.1001/jama.2013.168118
31. Wang, L, Gao, P, Zhang, M, Huang, Z, Zhang, D, Deng, Q, et al. Prevalence and Ethnic Pattern of Diabetes and Prediabetes in China in 2013. Jama (2017) 317:2515–23. doi:10.1001/jama.2017.7596
32. Chen, Y, Zhang, P, Wang, J, Gong, Q, An, Y, Qian, X, et al. Associations of Progression to Diabetes and Regression to normal Glucose Tolerance with Development of Cardiovascular and Microvascular Disease Among People with Impaired Glucose Tolerance: a Secondary Analysis of the 30 Year Da Qing Diabetes Prevention Outcome Study. Diabetologia (2021) 64:1279–87. doi:10.1007/s00125-021-05401-x
33. Liu, X, Li, C, Gong, H, Cui, Z, Fan, L, Yu, W, et al. An Economic Evaluation for Prevention of Diabetes Mellitus in a Developing Country: a Modelling Study. BMC public health (2013) 13:729. doi:10.1186/1471-2458-13-729
34. Liu, G, Li, Y, Hu, Y, Zong, G, Li, S, Rimm, EB, et al. Influence of Lifestyle on Incident Cardiovascular Disease and Mortality in Patients with Diabetes Mellitus. J Am Coll Cardiol (2018) 71:2867–76. doi:10.1016/j.jacc.2018.04.027
35. Wang, W, McGreevey, WP, Fu, C, Zhan, S, Luan, R, Chen, W, et al. Type 2 Diabetes Mellitus in China: a Preventable Economic burden. Am J Manag Care (2009) 15:593–601.
36. Asakura, M, Kim, J, Asanuma, H, Hamasaki, T, Tsukahara, K, Higashino, Y, et al. Does Treatment of Impaired Glucose Tolerance Improve Cardiovascular Outcomes in Patients with Previous Myocardial Infarction? Cardiovasc Drugs Ther (2017) 31:401–11. doi:10.1007/s10557-017-6740-3
37. Knowler, WC, Barrett-Connor, E, Fowler, SE, Hamman, RF, Lachin, JM, Walker, EA, et al. Reduction in the Incidence of Type 2 Diabetes with Lifestyle Intervention or Metformin. N Engl J Med (2002) 346:393–403. doi:10.1056/NEJMoa012512
38. Chiasson, JL, Josse, RG, Gomis, R, Hanefeld, M, Karasik, A, Laakso, M, et al. Acarbose for Prevention of Type 2 Diabetes Mellitus: the STOP-NIDDM Randomised Trial. Lancet (2002) 359:2072–7. doi:10.1016/s0140-6736(02)08905-5
39. Edwards, RA, Graham, A, Williams, M, Amati, M, Wright, C, Lee, M, et al. Quantifying a Strategic View of Diabetes Technology Impacts: a System Dynamics Approach. Diabetes Technol Ther (2009) 11:411–8. doi:10.1089/dia.2008.0089
40. Freebairn, L, Atkinson, J-A, Qin, Y, Nolan, CJ, Kent, AL, Kelly, PM, et al. Turning the Tide' on Hyperglycemia in Pregnancy: Insights from Multiscale Dynamic Simulation Modeling. BMJ Open Diabetes Res Care (2020) 8:e000975. doi:10.1136/bmjdrc-2019-000975
41. Sugiyama, T, Goryoda, S, Inoue, K, Sugiyama-Ihana, N, and Nishi, N. Construction of a Simulation Model and Evaluation of the Effect of Potential Interventions on the Incidence of Diabetes and Initiation of Dialysis Due to Diabetic Nephropathy in Japan. BMC Health Serv Res (2017) 17:833. doi:10.1186/s12913-017-2784-0
42. Guariguata, L, Guell, C, Samuels, TA, Rouwette, EAJA, Woodcock, J, Hambleton, IR, et al. Systems Science for Caribbean Health: the Development and Piloting of a Model for Guiding Policy on Diabetes in the Caribbean. Health Res Pol Syst (2016) 14:79. doi:10.1186/s12961-016-0150-z
43. Zhu, D, Zhou, D, Li, N, and Han, B. Predicting Diabetes and Estimating its Economic Burden in China Using Autoregressive Integrated Moving Average Model. Int J Public Health (2021) 66:1604449. doi:10.3389/ijph.2021.1604449
44. Liu, S, Li, Y, Zeng, X, Wang, H, Yin, P, Wang, L, et al. Burden of Cardiovascular Diseases in China, 1990-2016: Findings from the 2016 Global Burden of Disease Study. JAMA Cardiol (2019) 4:342–52. doi:10.1001/jamacardio.2019.0295
45. Mosenzon, O, Alguwaihes, A, Leon, JLA, Bayram, F, Darmon, P, Davis, TME, et al. CAPTURE: a Multinational, Cross-Sectional Study of Cardiovascular Disease Prevalence in Adults with Type 2 Diabetes across 13 Countries. Cardiovasc Diabetol (2021) 20:154. doi:10.1186/s12933-021-01344-0
46. Giugliano, D, Maiorino, MI, Bellastella, G, Chiodini, P, and Esposito, K. Glycemic Control, Preexisting Cardiovascular Disease, and Risk of Major Cardiovascular Events in Patients with Type 2 Diabetes Mellitus: Systematic Review with Meta-Analysis of Cardiovascular Outcome Trials and Intensive Glucose Control Trials. J Am Heart Assoc (2019) 8:e012356. doi:10.1161/jaha.119.012356
47. Liu, Z, Fu, C, Wang, W, and Xu, B. Prevalence of Chronic Complications of Type 2 Diabetes Mellitus in Outpatients - a Cross-Sectional Hospital Based Survey in Urban China. Health Qual Life Outcomes (2010) 8:62. doi:10.1186/1477-7525-8-62
48. Boyle, JP, Thompson, TJ, Gregg, EW, Barker, LE, and Williamson, DF. Projection of the Year 2050 burden of Diabetes in the US Adult Population: Dynamic Modeling of Incidence, Mortality, and Prediabetes Prevalence. Popul Health Metr (2010) 8:29. doi:10.1186/1478-7954-8-29
49. Homer, JB, and Hirsch, GB. System Dynamics Modeling for Public Health: Background and Opportunities. Am J Public Health (2006) 96:452–8. doi:10.2105/ajph.2005.062059
Keywords: diabetes, type 2 diabetes, prevention strategies, economic burden, Chinese population, health policies, system dynamic model, urban public health governance
Citation: Li H, Chang G-Y, Jiang Y-H, Xu L, Shen L, Gu Z-C, Lin H-W and Shi F-H (2022) System Dynamic Model Simulates the Growth Trend of Diabetes Mellitus in Chinese Population: Implications for Future Urban Public Health Governance. Int J Public Health 67:1605064. doi: 10.3389/ijph.2022.1605064
Received: 15 May 2022; Accepted: 01 November 2022;
Published: 11 November 2022.
Edited by:
Nino Kuenzli, Swiss Tropical and Public Health Institute (Swiss TPH), SwitzerlandReviewed by:
Anne Jörns, Hannover Medical School, GermanyCopyright © 2022 Li, Chang, Jiang, Xu, Shen, Gu, Lin and Shi. This is an open-access article distributed under the terms of the Creative Commons Attribution License (CC BY). The use, distribution or reproduction in other forums is permitted, provided the original author(s) and the copyright owner(s) are credited and that the original publication in this journal is cited, in accordance with accepted academic practice. No use, distribution or reproduction is permitted which does not comply with these terms.
*Correspondence: Zhi-Chun Gu, Z3V6aGljaHVuMjEzQDE2My5jb20=; Hou-Wen Lin, ZnJhbmtsaW42N0AxMjYuY29t; Fang-Hong Shi, c2hpZmFuZ2hvbmdAaG90bWFpbC5jb20=
†These authors share first authorship
 Hao Li
 Guo-Ying Chang1,3†
 Zhi-Chun Gu