- 1School of Public Health, Inner Mongolia Medical University, Hohhot, China
- 2National Center for Chronic and Non-Communicable Diseases Control and Prevention, Chinese Center for Disease Control and Prevention, Beijing, China
- 3Affiliated Hospital, Inner Mongolia Medical University, Hohhot, China
Objectives: This study investigated the relationship of socioeconomic status (SES), diet quality and overweight and obesity in adults aged 40–59 years in Inner Mongolia.
Methods: This cross-sectional study was based on the survey of Chronic Disease and Nutrition Monitoring in Adults in Inner Mongolia in 2015. Diet quality was evaluated by the Alternate Mediterranean Diet score (aMeds). SES was measured by household annual income. Generalized estimating equations and path analysis were performed to determine the association of SES, diet quality and overweight and obesity.
Results: Among participants, 63.0% had overweight and obesity. In high SES group, 66.4% had overweight and obesity. Higher SES was associated with a higher risk of overweight and obesity (OR = 1.352, 95%CI: 1.020–1.793). And higher aMeds was associated with a lower risk of overweight and obesity (OR = 0.597, 95%CI: 0.419–0.851). There was a positive correlation between SES and the intake of red and processed meat (r = 0.132, p < 0.05). Higher intake of red and processed meat was associated with lower diet quality (β = −0.34). And lower diet quality was associated with a higher risk of overweight and obesity (β = −0.10).
Conclusion: In Inner Mongolia, during the period of economic transition, people aged 40–59 years in high SES had poor diet quality, which was related to a higher risk of overweight and obesity.
Introduction
Overweight and obesity are risk factors for many chronic non-communicable diseases, such as cardiovascular disease, type 2 diabetes, and cancer [1, 2]. In recent years, the prevalence of overweight and obesity increased globally which accompanied by severe health damage and lower life quality among people [3]. 2017 Global Burden of Disease study showed that high body mass index (BMI) was the fourth risk factor leading to death [4]. Obesity had a great impact on middle-aged people [5], their lifestyle risk factors (smoking, unhealthy diet, or inadequate physical activity) could significantly increase the risk of chronic diseases in their old age [6–8]. The effective control of overweight and obesity among middle-aged people can significantly reduce the incidence of obesity-related chronic disease in their old age [9].
Socioeconomic status (SES) has an influence on overweight and obesity [10]. Generally, the association between SES and the risk of obesity is negative in high-income countries [11]. However, in some low- and middle-income countries (LMICs), people in high SES suffered a higher risk of overweight and obesity [12, 13]. Among the top 10 countries ranked by obese people number, eight countries were LMICs, including Brazil, China, India, etc., [14].
Diet quality plays an important role in the development of overweight and obesity in different SES participants. Some studies showed that high SES participants would adhere to healthy diet [15, 16]. A review of 29 meta-analyses demonstrated that higher adherence to the Mediterranean diet could reduce overall mortality, including diabetes, cardiovascular disease, and mortality of cancer [17]. However, some studies showed that some high SES individuals tended to choose some unhealthy dietary patterns, such as rich in animal fats or sugar which may relate to a higher risk of overweight and obesity [18, 19].
China is a middle-income country, and Inner Mongolia is an underdeveloped region in the north of the country. In recent decades, Inner Mongolia has been in a period of rapid economic development. In 2015, the prevalence of obesity was 18.1% [20], which was in a high level in China (11.3%) [21]. Our previous studies illustrated that people in Inner Mongolia deviated from healthy diet, and the prevalence of hypertension and diabetes were high in adults [22, 23]. Based on previous studies, we aimed to explore the relationship of SES, diet quality and overweight and obesity in adults aged 40–59 years in Inner Mongolia, for the purpose of contributing to the effective prevention and control of the overweight and obesity.
Methods
Design and Setting of the Study
This cross-sectional study was based on the survey of Chronic Disease and Nutrition Monitoring in Adults in Inner Mongolia in 2015. A multi-stage cluster random sampling method was used to obtain representative samples. A total of 841 participants aged 40–59 years were enrolled in this study. They were from eight monitoring sites including the urban, rural and pastoral areas in the eastern, central and western regions of Inner Mongolia. All participants provided written informed consent before the start of the investigation.
Data Collection
All participants completed a questionnaire including information on sociodemographic characteristics, health-related behaviors, and diet. Height and weight were measured by trained investigators who followed standard protocols. 24-h dietary recall for three consecutive days was used to collect dietary data, all participants reviewed and described the types and amounts of all foods (including alcohol) they consumed.
Measurements
Assessment of Diet Quality
The Alternate Mediterranean Diet score (aMeds) was used to evaluate participants’ adherence to the Mediterranean diet. The range of aMeds is 0–9. The higher the score, the better the diet quality. The aMeds components include whole grains, vegetables, fruits, legumes, nuts, fish, and the ratio of monounsaturated to saturated fat. Intake above the sex-specific median is scored as 1 point, others are scored as 0 points. Additionally, red and processed meat consumption below the median is scored as 1 point, others are scored as 0 points. For alcohol, 1 point is given if consumption between 5 and 15 g per day; others are assigned 0 points [24].
Assessment of Average Intake of Each Food Group
Based on the dietary data from 24-h dietary recall for three consecutive days, the average intake (g/day) of each food group was calculated among participants over 3 days [25].
Definition of Overweight and Obesity
BMI was calculated as weight in kilograms divided by height in meters squared, which was used as an indicator of overweight and obesity. BMI was divided into two categories: underweight or normal weight (<24 kg/m2) and overweight and obesity (≥24 kg/m2) [26].
Definition of SES
Household annual income was used as an indicator of SES, which was categorized as high SES [≥RMB 30,000 (US$4687)] or low SES [<RMB 30,000 (US$4687)] [27].
Covariates
Sociodemographic characteristics included age, gender, ethnicity, marital status, residing location, and education level. Health-related behaviors were smoking status, drinking, and physical activity. The definition of variables was showed in Supplementary Table S1.
Statistical Analysis
Continuous variables were expressed as means and standard deviations, and the t-test was used for two groups comparisons. Categorical variables were expressed as numbers and percentages, and the chi-square test was used to test significant differences between groups.
The aMeds was categorized into tertiles T1, T2, and T3. Higher scores indicated more compliance with the Alternate Mediterranean Diet, lower scores indicated more deviation. The dietary intake of participants and the recommended nutrient intake was compared [28].
Partial correlation analysis was used to examine the correlation between SES and aMeds, foods and nutrients. Generalized estimating equations were used to examine the association of SES and diet quality with the risk of overweight and obesity. Partial correlation analysis and generalized estimating equations were adjusted for age, gender, ethnicity, marital status, educational level, residing location, smoking status, drinking, physical activity. Path analysis was conducted to test the direct and indirect (through diet quality) effects of SES on the risk of overweight and obesity. The significance α was set to 0.05 and p ≤ 0.05 was considered significant. IBM SPSS Statistics 25.0 (IBM Corp, Armonk, NY, United States) and AMOS 25.0 were used for data analysis.
Results
Sociodemographic Characteristics of the Participants
A total of 841 participants aged 40–59 years were included in the present study. Just over half of the participants (51.2%) had high SES. Overall, 47.4% were men, 40.7% were urban, 80.2% were Han ethnicity, 14.4% were Mongolian ethnicity, 97.4% were married, and 40.1% had a primary school education or lower.
A total of 63.0% of the participants had overweight and obesity. Among those in high SES, 66.4% had overweight and obesity, which was higher than participants in low SES (59.5%). The prevalence of overweight and obesity among urban participants (68.1%) was higher than rural participants (59.5%) (Table 1).
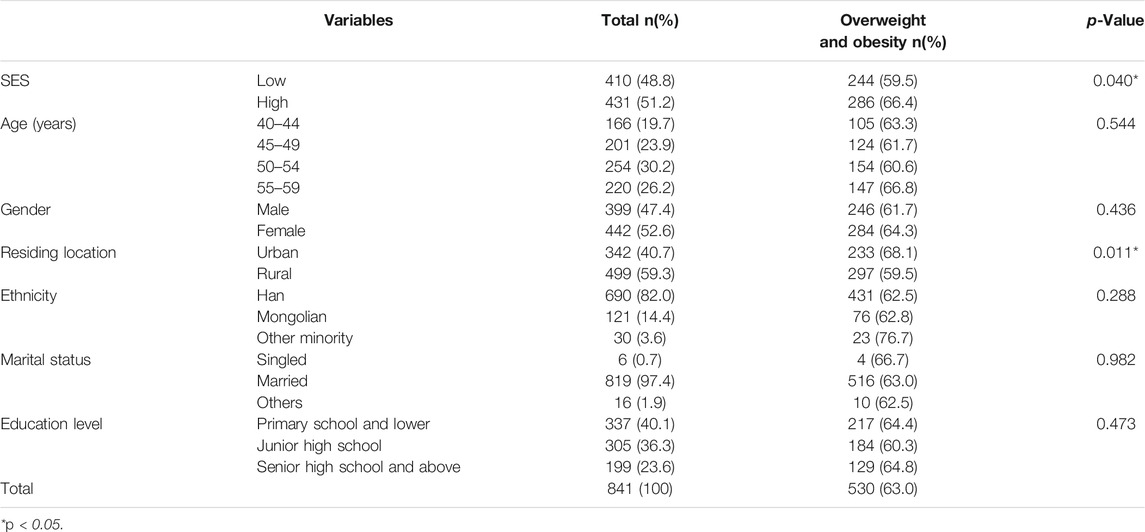
TABLE 1. Sociodemographic characteristics of the adults aged 40–59. The survey of Chronic Disease and Nutrition Monitoring in Adults in Inner Mongolia, Inner Mongolia, 2015.
A total of 31.0% of the participants were in the aMeds T1 group. There were significant differences in overweight and obesity among aMeds and smoking status (p < 0.05). The highest prevalence of overweight and obesity (69.7%) was in the lowest aMeds group (T1) (Table 2).

TABLE 2. The proportion of overweight and obesity in different group of the Alternate Mediterranean Diet score and lifestyle factors. The survey of Chronic Disease and Nutrition Monitoring in Adults in Inner Mongolia, Inner Mongolia, 2015.
Dietary Intake by SES
The average intake of different foods were showed in Table 3. The intake of cereals and tubers, legumes and nuts, vegetables, fruits, aquatic products, eggs, and dairy products were lower than the RNI (Table 3).
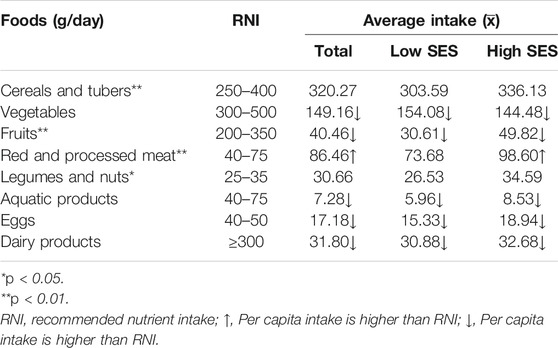
TABLE 3. The comparison of dietary intake of participants and the recommended nutrient intake. The survey of Chronic Disease and Nutrition Monitoring in Adults in Inner Mongolia, Inner Mongolia, 2015.
There were significant differences by SES level in the intake of cereals and tubers, fruits, red and processed meat, legumes and nuts (p < 0.05). The intake of cereals and tubers, fruits, red and processed meat, and legumes and nuts were higher in high SES group than in low SES (Table 3).
Relationships Between SES and aMeds, Foods and Nutritions
The partial correlation analysis showed that there was no correlation between SES and aMeds. There were positive correlations between SES and the intake of fruits and of red and processed meat (r = 0.085 and r = 0.132, respectively; p < 0.05). SES was positively correlated with the intake of energy and protein (r = 0.097 and r = 0.187, respectively; p < 0.01) (Table 4).
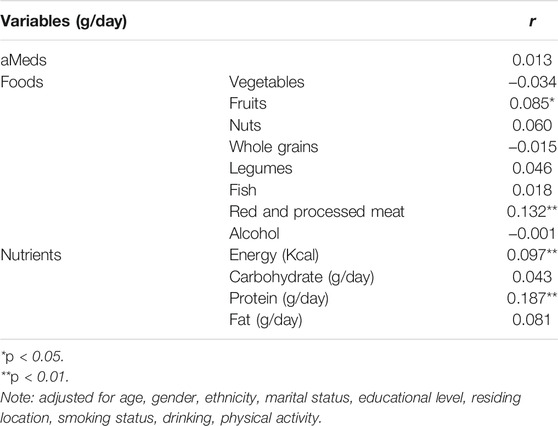
TABLE 4. The partial correlation analysis among socioeconomic status and the Alternate Mediterranean Diet scores, foods and nutrients. The survey of Chronic Disease and Nutrition Monitoring in Adults in Inner Mongolia, Inner Mongolia, 2015.
Association of aMeds and SES with the Risk of Overweight and Obesity
In the generalized estimating equations, aMeds and SES was associated with the risk of overweight and obesity. Compared with those in low SES, participants in high SES had a higher risk of overweight and obesity [odds ratio (OR) = 1.352, 95% CI: 1.020–1.793]. Compared with those in low aMeds, participants in highest aMeds had a lower risk of overweight and obesity (OR = 0.597, 95% CI: 0.419–0.851) (Table 5).
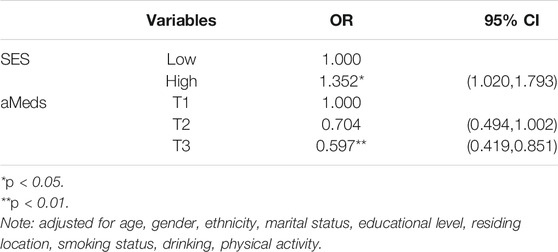
TABLE 5. The relationship between the Alternate Mediterranean Diet score, socioeconomic status and overweight and obesity. The survey of Chronic Disease and Nutrition Monitoring in Adults in Inner Mongolia, Inner Mongolia, 2015.
Path Analysis of the Association of SES and Diet Quality with Overweight and Obesity
The path analysis showed that the direct effect of SES on the risk of overweight and obesity was significant (β = 0.06). More importantly, the indirect effect of SES on overweight and obesity was also significant, and it mainly related to the intake of red and processed meat (β = 0.18). Higher intake of red and processed meat was associated with lower diet quality (β = −0.34), and lower diet quality was associated with a higher risk of overweight and obesity (β = −0.10). Therefore, diet quality had a crucial mediating effect on the association between SES and the risk of overweight and obesity (Figure 1).
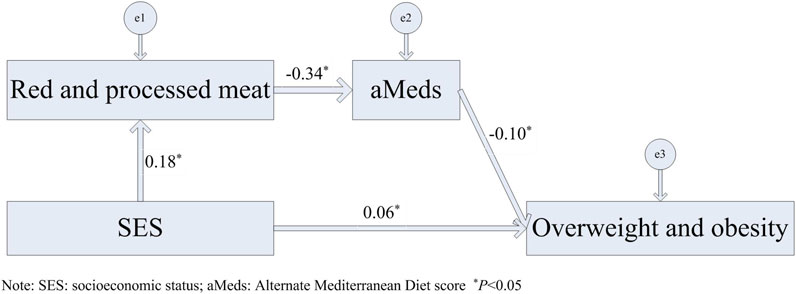
FIGURE 1. Path analysis of the associations of socioeconomic status and diet quality with overweight and obesity in adults aged 40–59 years. The survey of Chronic Disease and Nutrition Monitoring in Adults in Inner Mongolia, Inner Mongolia, 2015.
Discussion
Inner Mongolia is an underdeveloped region in China with insufficient medical resources. Over the last 10 years, Inner Mongolia has been in a period of rapid economic development. In our study, 63.0% participants aged 40–59 years had overweight and obesity, which was in a high level in China (11.3%) [21]. Among the participants in high SES, 66.4% of had overweight and obesity. The participants deviated from a healthy diet, and 69.7% of the participants in low diet quality had overweight and obesity. In past 10 years, participants were facing increased dietary problems and the risk of overweight and obesity in Inner Mongolia.
Comparisons with Other Studies
Previous evidence demonstrated that high SES was associated with better health outcomes [29–31]. However, with the rapid development of economic in LMICs, individuals in high SES suffered a higher risk of obesity compared with low SES [32]. In our study, high SES was associated with a higher risk of overweight and obesity, and the OR was 1.351. Similarly, previous studies showed positive correlations among SES level and obesity, diabetes, metabolic syndrome, and cardiovascular disease in LMICs [12, 33, 34]. A study covering 757,958 participants showed that 70–90% burden of diabetes, hypertension, and obesity was concentrated in high SES group [35].
Modifiable dietary characteristics are important explanatory factors for the association between SES and overweight and obesity. Some studies demonstrated that individuals in high SES adhered to relatively healthy dietary patterns [16, 36, 37]. In contrast, some individuals in high SES who were able to obtain excess food, tended to choose a high-fat and high-calorie diet during the economic transition in LMICs [18, 38]. Deviating from a healthy dietary pattern would result in an increase of overweight and obesity including their complications [39]. Similarly, our study also showed that diet quality had a significant mediating effect on the association between SES and the risk of overweight and obesity. Participants in high SES had a relatively high intake of red and processed meat, which resulted in poorer diet quality, leading to a higher risk of overweight and obesity. More importantly, the indirect effect of SES on overweight and obesity was also significant, working mainly through the intake of red and processed meat. Our result also showed that the intake of red and processed meat in all participants was higher than the RNI, especially in high SES participants. Energy intake of high SES participants was also higher than low SES. Excessive intake of red and processed meat led to excessive energy intake, which reflected poor diet quality and associated with a higher risk of obesity and diabetes [40, 41].
Strengths and Limitations
This study was based on the survey of Chronic Disease and Nutrition Monitoring in Adults in Inner Mongolia in 2015 conducted in urban, agricultural, and pastoral areas. A multi-stage cluster random sampling method was used to obtain a representative sample of participants. However, this cross-sectional study could only show the association of SES and diet quality with the risk of overweight and obesity, but unable to demonstrate causality of them. Therefore, in the future, it is necessary to conduct more prospective studies on the complex effects of SES and diet quality on the risk of overweight and obesity among middle-aged people especially in LMICs.
Conclusion
During the period of economic transition in Inner Mongolia, high SES participants aged 40–59 years had a relatively poor diet quality, which was related to a higher risk of overweight and obesity. Therefore, the health status of individuals in high SES should be given more attention, especially for middle-aged people in the relatively underdeveloped region in LMICs.
Ethics Statement
The studies involving human participants were reviewed and approved by the Ethical Committee of the National Institute for Chinese Center for Disease Control and Prevention. The patients/participants provided their written informed consent to participate in this study.
Author Contributions
All authors listed have made a substantial, direct, and intellectual contribution to the work and approved it for publication.
Funding
This study was funded by National Natural Science Foundation of China (grant number 81960603) (Study on the Mechanism of NAMPT Regulated by Hyperglycemia and CpnT Promoting Macrophage Death in Diabetes with Pulmonary Tuberculosis Infection) and Natural Science Foundation of Inner Mongolia (grant number 2019MS08112). (Study on Nutrition Epidemiology of Obesity and Metabolic Abnormalities in Adults in Inner Mongolia).
Conflict of Interest
The authors declare that the research was conducted in the absence of any commercial or financial relationships that could be construed as a potential conflict of interest.
Acknowledgments
We thank all participants and investigators for the Chronic Disease and Nutrition Monitoring in Adults in Inner Mongolia in 2015.
Supplementary Material
The Supplementary Material for this article can be found online at: https://www.ssph-journal.org/articles/10.3389/ijph.2021.1604107/full#supplementary-material
References
1. Seidell, JC, and Halberstadt, J. The global burden of obesity and the challenges of prevention. Ann Nutr Metab (2015). 66(Suppl. 2):7–12. doi:10.1159/000375143
2. Mkuu, RS, Epnere, K, and Chowdhury, MAB. Prevalence and Predictors of Overweight and Obesity Among Kenyan Women. Prev Chronic Dis (2018). 15:15E44. doi:10.5888/pcd15.170401
3. Roberto, CA, Swinburn, B, Hawkes, C, Huang, TT-K, Costa, SA, Ashe, M, et al. Patchy progress on obesity prevention: emerging examples, entrenched barriers, and new thinking. The Lancet (2015). 385(9985):2400–9. doi:10.1016/S0140-6736(14)61744-X
4.GBD 2017 Risk Factor Collaborators. Global, regional, and national comparative risk assessment of 84 behavioural, environmental and occupational, and metabolic risks or clusters of risks for 195 countries and territories, 1990-2017: a systematic analysis for the Global Burden of Disease Study 2017. Lancet. (2018). 392(10159):1923–94. doi:10.1016/S0140-6736(18)32225-6
5. Yoshimoto, K, Noda, T, and Imamura, T. Influence of Underlying Diseases and Age on the Association between Obesity and All-Cause Mortality in Post-Middle Age[J]. Health (2018). 10(9):1171–84. doi:10.4236/health.2018.109089
6. Ashley, C, Halcomb, E, McInnes, S, Robinson, K, Lucas, E, Harvey, S, et al. Middle-aged Australians' perceptions of support to reduce lifestyle risk factors: a qualitative study. Aust J Prim Health (2020). 26(4):313–8. doi:10.1071/PY20030
7. Dalmau, R. Heart failure: A likely horizon in the elderly that could be prevented by avoiding obesity in middle age. Eur J Prev Cardiolog (2020). 27(7):715–6. doi:10.1177/2047487319880360
8. Whitmer, RA, Gunderson, EP, Barrett-Connor, E, Quesenberry, CP, and Yaffe, K. Obesity in middle age and future risk of dementia: a 27 year longitudinal population based study. BMJ (2005). 11330(7504):1360. doi:10.1136/bmj.38446.466238.E0
9. Jia, L, Lu, H, Wu, J, Wang, X, Wang, W, Du, M, et al. Association between diet quality and obesity indicators among the working-age adults in Inner Mongolia, Northern China: a cross-sectional study. BMC Public Health (2020). 20(1):1165. doi:10.1186/s12889-020-09281-5
10. Xiao, Y, Zhao, N, Wang, H, Zhang, J, He, Q, Su, D, et al. Association between socioeconomic status and obesity in a Chinese adult population. BMC Public Health (2013). 13:355. doi:10.1186/1471-2458-13-355
11. McLaren, L. Socioeconomic status and obesity. Epidemiologic Rev (2007). 29:29–48. doi:10.1093/epirev/mxm001
12. Dinsa, GD, Goryakin, Y, Fumagalli, E, and Suhrcke, M. Obesity and socioeconomic status in developing countries: a systematic review. Obes Rev (2012). 13(11):1067–79. doi:10.1111/j.1467-789X.2012.01017.x
13. Rachmi, CN, Li, M, and Alison Baur, L. Overweight and obesity in Indonesia: prevalence and risk factors-a literature review. Public Health (2017). 147:20–9. doi:10.1016/j.puhe.2017.02.002
14. Ng, M, Fleming, T, Robinson, M, Thomson, B, Graetz, N, Margono, C, et al. Global, regional, and national prevalence of overweight and obesity in children and adults during 1980-2013: a systematic analysis for the Global Burden of Disease Study 2013. Lancet (2014). 384(9945):766–81. doi:10.1016/S0140-6736(14)60460-8
15. Giskes, K, Avendaňo, M, Brug, J, and Kunst, AE. A systematic review of studies on socioeconomic inequalities in dietary intakes associated with weight gain and overweight/obesity conducted among European adults. Obes Rev (2010). 11(6):413–29. doi:10.1111/j.1467-789X.2009.00658.x
16. Jacka, FN, Cherbuin, N, Anstey, KJ, and Butterworth, P. Dietary patterns and depressive symptoms over time: examining the relationships with socioeconomic position, health behaviours and cardiovascular risk. PLoS One (2014). 9(1):e87657. doi:10.1371/journal.pone.0087657
17. Dinu, M, Pagliai, G, Casini, A, and Sofi, F. Mediterranean diet and multiple health outcomes: an umbrella review of meta-analyses of observational studies and randomised trials. Eur J Clin Nutr (2018). 72:30–43. doi:10.1038/ejcn.2017.58
18. Moore, S, Hall, JN, Harper, S, and Lynch, JW. Global and national socioeconomic disparities in obesity, overweight, and underweight status. J Obes (2010). 2010:1–11. doi:10.1155/2010/514674
19. Quispe, R, Benziger, CP, Bazo-Alvarez, JC, Howe, LD, Checkley, W, Gilman, RH, et al. The Relationship between Socioeconomic Status and CV Risk Factors: The CRONICAS Cohort Study of Peruvian Adults. gh (2016). 11(1):121–30. e2. doi:10.1016/j.gheart.2015.12.005
20. Wang, R. hypertension in adults in Inner Mongolia[D]. Mongolia: Inner Mongolia Medical University (2018). Study on the relationship between dietary patterns and obesity
21. Yingjun, M. Trends in the prevalence of overweight and obesity as well as the relation in the risk of all-cause mortality[D]. Heibei: Heibei Medical University (2017).
22. Tan, S, Lu, H, Song, R, Wu, J, Xue, M, Qian, Y, et al. Dietary quality is associated with reduced risk of diabetes among adults in Northern China: a cross-sectional study. Br J Nutr (2020). 126:923–32. doi:10.1017/S0007114520004808
23. Wang, X, Liu, A, Du, M, Wu, J, Wang, W, Qian, Y, et al. Diet quality is associated with reduced risk of hypertension among Inner Mongolia adults in northern China. Public Health Nutr (2020). 23(9):1543–54. doi:10.1017/S136898001900301X
24. Fung, TT, Rexrode, KM, Mantzoros, CS, Manson, JE, Willett, WC, and Hu, FB. Mediterranean diet and incidence of and mortality from coronary heart disease and stroke in women. Circulation (2009). 119(8):1093–100. doi:10.1161/circulationaha.108.816736
25. Zhang, Q, Chen, X, Liu, Z, Varma, D, Wan, R, Wan, Q, et al. Dietary Patterns in Relation to General and Central Obesity among Adults in Southwest China. Ijerph (2016). 13(11):1080. doi:10.3390/ijerph13111080
26.Chinese Center For Disease Control And Prevention. Chinese adult overweight and obesity prevention and control guidelines. Beijing: People's Health Press (2006).
27. Wang, X, Zhang, T, Wu, J, Yin, S, Nan, X, Du, M, et al. The Association between Socioeconomic Status, Smoking, and Chronic Disease in Inner Mongolia in Northern China. Ijerph (2019). 16(2):169. doi:10.3390/ijerph16020169
28.Chinese Nutrition Society. Dietary Guidelines for Chinese Residents. Beijing: People's Medical Publishing House (2016). p. 1–338. [M].
29. Marmot, M, Friel, S, Bell, R, Houweling, TA, and Taylor, SCommission on Social Determinants of Health. Closing the gap in a generation: health equity through action on the social determinants of health. The Lancet (2008). 372(9650):1661–9. doi:10.1016/S0140-6736(08)61690-6
30. Jerliu, N, Toçi, E, Burazeri, G, Ramadani, N, and Brand, H. Prevalence and socioeconomic correlates of chronic morbidity among elderly people in Kosovo: a population-based survey. BMC Geriatr (2013). 13:22. doi:10.1186/1471-2318-13-22
31. Goulden, R, Ibrahim, T, and Wolfson, C. Is high socioeconomic status a risk factor for multiple sclerosis? A systematic review. Eur J Neurol (2015). 22(6):899–911. doi:10.1111/ene.12586
32. Jiwani, SS, Carrillo-Larco, RM, Hernández-Vásquez, A, Barrientos-Gutiérrez, T, Basto-Abreu, A, Gutierrez, L, et al. The shift of obesity burden by socioeconomic status between 1998 and 2017 in Latin America and the Caribbean: a cross-sectional series study. Lancet Glob Health (2019). 7(12):e1644–e1654. doi:10.1016/S2214-109X(19)30421-8
33. Zhu, S, Hu, J, McCoy, TP, Li, G, Zhu, J, Lei, M, et al. Socioeconomic Status and the Prevalence of Type 2 Diabetes Among Adults in Northwest China. Diabetes Educ (2015). 41(5):599–608. doi:10.1177/0145721715598382
34. Subramanian, S, Corsi, DJ, Subramanyam, MA, and Davey Smith, G. Jumping the gun: the problematic discourse on socioeconomic status and cardiovascular health in India. Int J Epidemiol (2013). 42(5):1410–26. doi:10.1093/ije/dyt017
35. Corsi, DJ, and Subramanian, SV. Socioeconomic Gradients and Distribution of Diabetes, Hypertension, and Obesity in India. JAMA Netw Open (2019). 2(4):e190411. doi:10.1001/jamanetworkopen.2019.0411
36. Darmon, N, and Drewnowski, A. Does social class predict diet quality. Am J Clin Nutr (2008). 87(5):1107–17. doi:10.1093/ajcn/87.5.1107
37. Mullie, P, Clarys, P, Hulens, M, and Vansant, G. Dietary patterns and socioeconomic position. Eur J Clin Nutr (2010). 64(3):231–8. doi:10.1038/ejcn.2009.145
38. Pampel, FC, Denney, JT, and Krueger, PM. Obesity, SES, and economic development: a test of the reversal hypothesis. Soc Sci Med (2012). 74(7):1073–81. doi:10.1016/j.socscimed.2011.12.028
39. Lampuré, A, Castetbon, K, Deglaire, A, Schlich, P, Péneau, S, Hercberg, S, et al. Associations between liking for fat, sweet or salt and obesity risk in French adults: a prospective cohort study. Int J Behav Nutr Phys Act (2016). 13:74. doi:10.1186/s12966-016-0406-6
40. Ford, ND, Patel, SA, and Narayan, KMV. Obesity in Low- and Middle-Income Countries: Burden, Drivers, and Emerging Challenges. Annu Rev Public Health (2017). 38:145–64. doi:10.1146/annurev-publhealth-031816-044604
Keywords: socioeconomic status, dietary quality, alternate Mediterranean diet score, overweight and obesity, economic transition
Citation: Su Y, Du S, Yang M, Wu J, Lu H and Wang X (2021) Socioeconomic Determinants of Diet Quality on Overweight and Obesity in Adults Aged 40–59 Years in Inner Mongolia: A Cross-Sectional Study. Int J Public Health 66:1604107. doi: 10.3389/ijph.2021.1604107
Received: 25 March 2021; Accepted: 13 October 2021;
Published: 08 November 2021.
Edited by:
Karin De Ridder, Scientific Direction Epidemiology and Public Health, Sciensano, BelgiumReviewed by:
Gobopamang Letamo, University of Botswana, BotswanaCopyright © 2021 Su, Du, Yang, Wu, Lu and Wang. This is an open-access article distributed under the terms of the Creative Commons Attribution License (CC BY). The use, distribution or reproduction in other forums is permitted, provided the original author(s) and the copyright owner(s) are credited and that the original publication in this journal is cited, in accordance with accepted academic practice. No use, distribution or reproduction is permitted which does not comply with these terms.
*Correspondence: Haiwen Lu, bGh3QGltbXUuZWR1LmNu; Xuemei Wang, d2FuZ3htX3pzdUAxNjMuY29t
†These authors have contributed equally to this work and share joint first authorship
This Original Article is part of the IJPH Special Issue “Food as a Public Health Issue”
 Yuenan Su1†
 Xuemei Wang